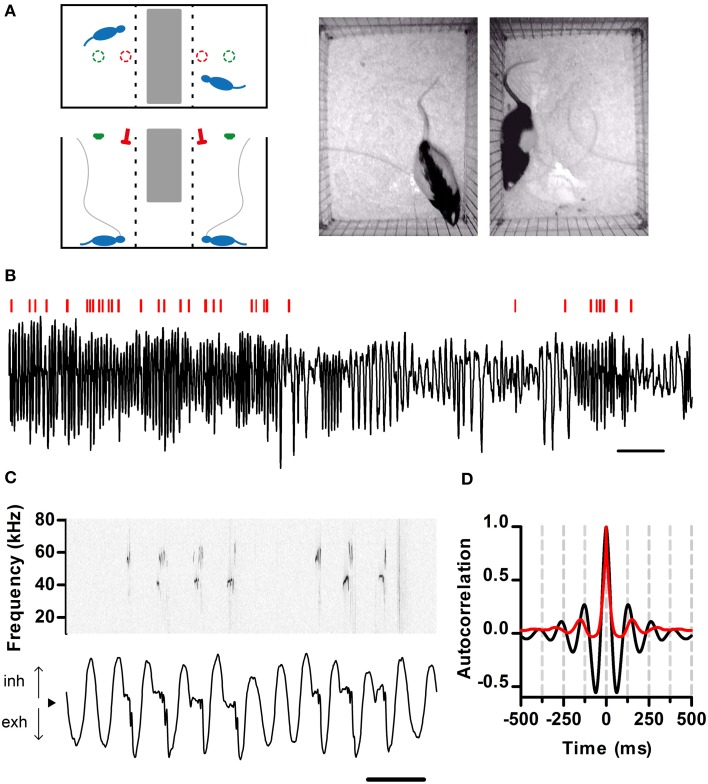
Figure 1.
Simultaneous recording of respiration and ultrasonic vocalization. (A) Left: Schematic of the recording arena as viewed from the top (top) and side (bottom). The position of the ultrasonic microphones (red) and video cameras (green) is shown. Tubing (gray) connects the nasal cannulae with pressure sensors. Right: Snapshot of rats simultaneously behaving in the arena. (B) Segment of intranasal pressure (black) recorded from a rat in a social setting. Red bars: periods of ultrasonic vocal output detected for this rat. Scale bar: 2 s. From here on, inhalations are plotted as positive deflections of the pressure trace. (C) Detailed view of respiration (bottom) and ultrasonic vocalizations (top; sonogram). From here on, black arrowheads denote zero relative intranasal pressure. Scale bar: 250 ms. (D) Autocorrelations of respiration (black) and ultrasonic vocalizations (red) from a 10 min recording segment. Note signals show similar periodicity, with first peaks at 130 and 150 ms respectively (eq. 7.7 and 6.7 Hz). (A–C) same data set.

