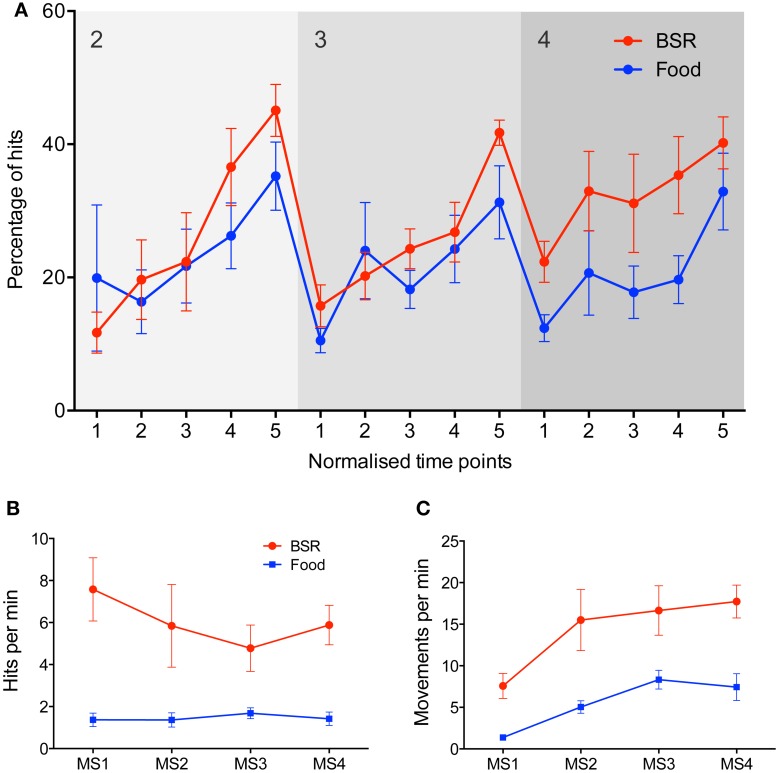
Figure 3.
Comparisons between food and BSR reinforcers in joystick task performance. (A) Group average performance across milestones 2–4, with five normalized time points within each milestone on the x-axis. The y-axis represents accuracy–the percentage of hits out of all joystick movements. No significant difference in accuracy was found between food (blue, n = 6) and BSR (red, n = 7) rats [Three-Way repeated measures ANOVA, F(1, 11) = 4.09, p > 0.05], although there was a trend to higher accuracy by BSR-reinforced rats (p = 0.068), which is particularly evident in milestone 4. A significant main effect of normalized time point was found [F(4, 44) = 26.12, p < 0.05], indicating learning progression through milestones. (B) Mean hit rate, defined as hits per min, across each milestone in the joystick task for food (blue, n = 6) and BSR (red, n = 7) rats. BSR produced a significantly higher hit rate than food reward [F(1, 44) = 33.05, p < 0.05]. (C) Mean movement rate, defined as joystick movements (hits or misses) per min, across each milestone in the joystick task for food (blue) and BSR (red) rats. BSR rats performed significantly more joystick movements than food reward rats [F(1, 44) = 32.99, p < 0.05]. Error bars indicate S.E.M.

