
Fig. 4.
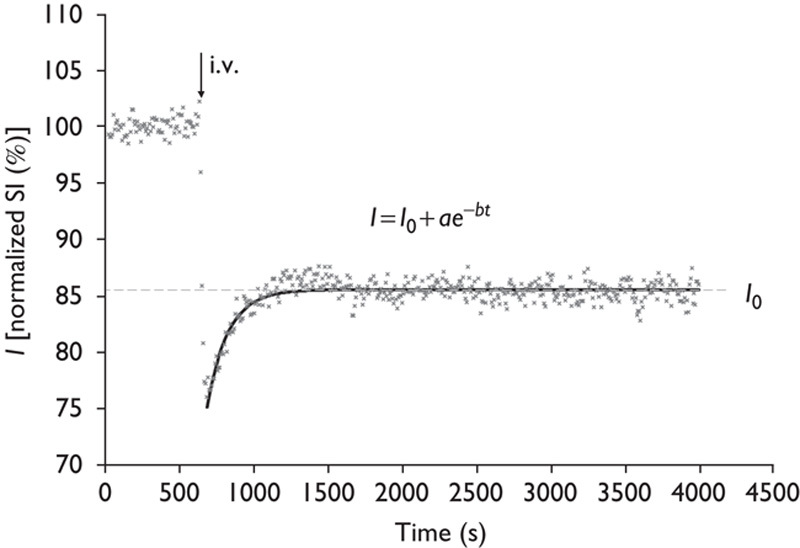
Decay curve fitting. Intensities at the steady state of each area, expressed as % against the averaged intensity of identical pixel before administration of H217O, were determined by fitting their time course by the function: I=I0+ae−bt. I0 denotes the normalized signal intensity (SI) at infinite time (t=∞) calculated from the fitted curve. i.v., intravenously.