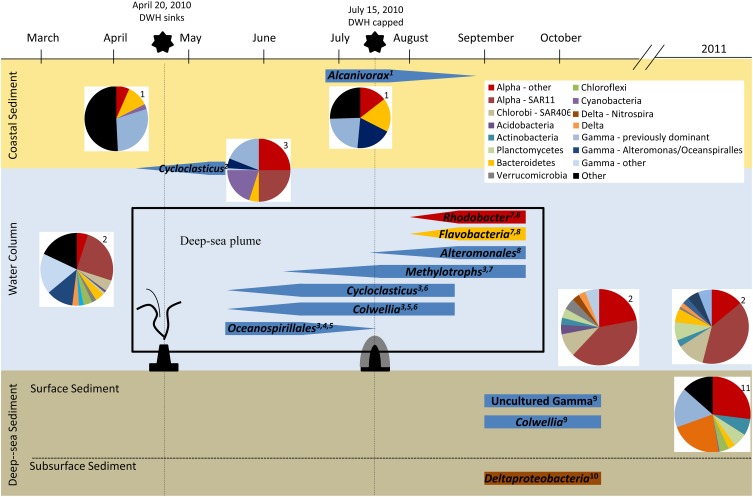
Figure 2.
Overview of microbial response to the DWH oil spill. Data from numerous studies following the DWH oil spill are represented in this schematic using approximations from the published data referenced. 1, Kostka et al., 2011; 2, Yang et al., in press; 3, Redmond and Valentine, 2012; 4, Hazen et al., 2010; 5, Mason et al., 2012; 6, Valentine et al., 2010; 7, Kessler et al., 2011b; 8, Dubinsky et al., 2013; 9, Mason et al., 2014b; 10, Kimes et al., 2013; 11, Liu and Liu, 2013.

