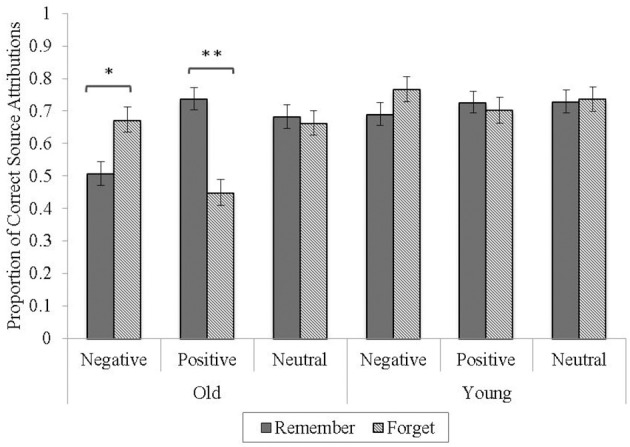
Figure 2.

Proportion of correct source attributions as a function of age, valence, and word type. Error bars represent standard errors of the means. *p < 0.05, **p < 0.01.

Proportion of correct source attributions as a function of age, valence, and word type. Error bars represent standard errors of the means. *p < 0.05, **p < 0.01.