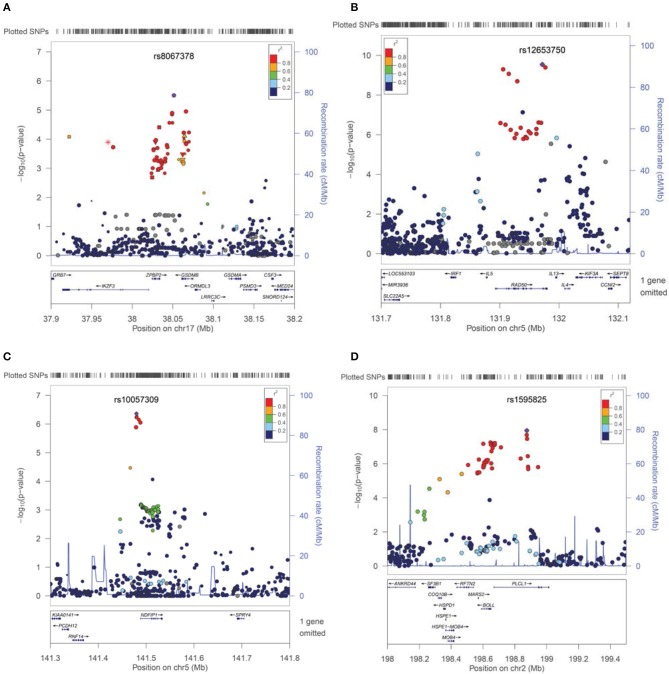
Figure 2.
Association results and signals contributing to Asthma, Eosinophilic Esophagitis, Mental Retardation, and Developmental Delays. SNPs are plotted by position in a 0.2 Mb window against association signals (−log10 P-value). For each trait, the most significant SNP is highlighted. Estimated recombination rates (from HapMap) are plotted in cyan to reflect the local LD structure. The SNPs surrounding the most significant SNP, are color-coded to reflect their LD with identified SNP (taken from pairwise r2 values from the HapMap CEU database, www.hapmap.org). Regional plots were generated using LocusZoom (http://csg.sph.umich.edu/locuszoom). (A) Cluster of the association effect for asthma at 17q21 near the gasdermin-B (GSDMB) gene. (B) Association signal for Eosinophilic Esophagitis at 5q31 (IL5-IL13 cluster region). (C) Cluster of association near the NDFIP1 gene for Mental Retardation traits. (D) Plot of association effects in the PLCL1 region for Developmental Delays-Speech Disorders.

