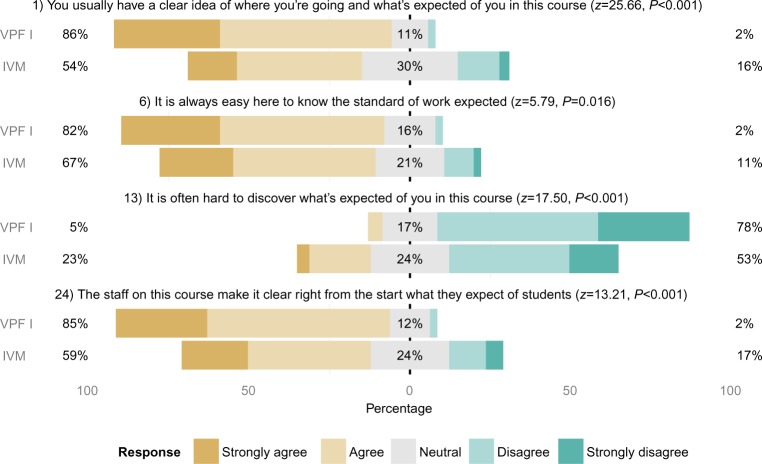
Figure 3.
Factor 4 (“student expectations”): Likert responses to items grouped in Factor 4.
Notes: Percentage values refer to the proportion of positive (orange), neutral (gray), and negative (green) responses. The difference in response between cohorts was tested for each question, and the Kruskal–Wallis results are presented alongside each question. There is a significant difference in mean response between cohorts (Kruskal–Wallis z=21.49; P<0.001).
Abbreviations: VPF I, Veterinary Professional Foundations I; IVM, Introduction to Veterinary Medicine.

