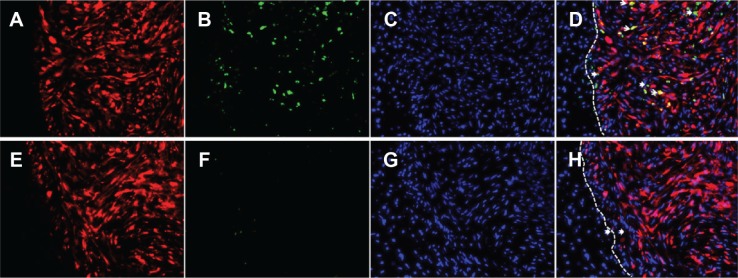
Figure 6.

In vivo distribution of coumarin 6-labeled TNPs (A–D) and NPs (E–H) in glioma tissues 72 hours after intravenous administration. (D) Is a merger of (A–C). (H) Is a merger of (E–G). Blue, cell nuclei; green, coumarin 6-labeled NPs; red, glioma cells expressing red fluorescence protein; white dashed line, border of the glioma. In (D) and (H), the white arrows indicate NP overlay with glioma cells, and the dovetail arrows indicate NP distribution in extracellular matrix. Magnification 200-fold.
Abbreviations: NPs, nanoparticles; CREKA, cysteine–arginine–glutamic acid–lysine–alanine; TNPs, CREKA-conjugated NPs.
