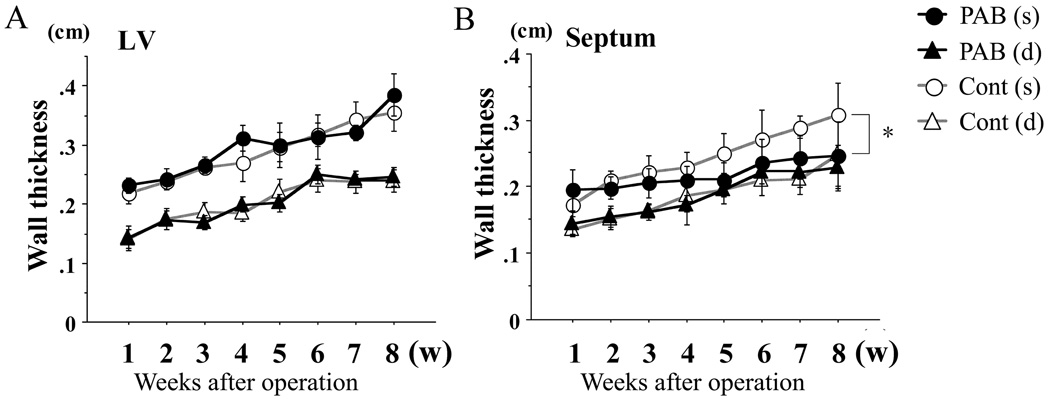
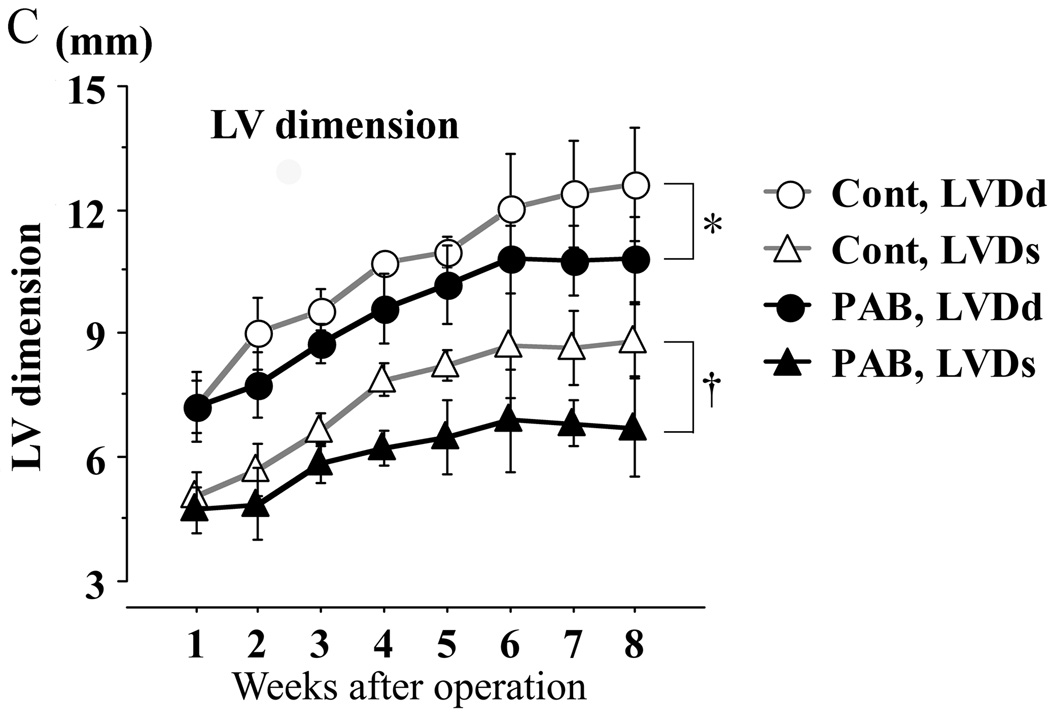
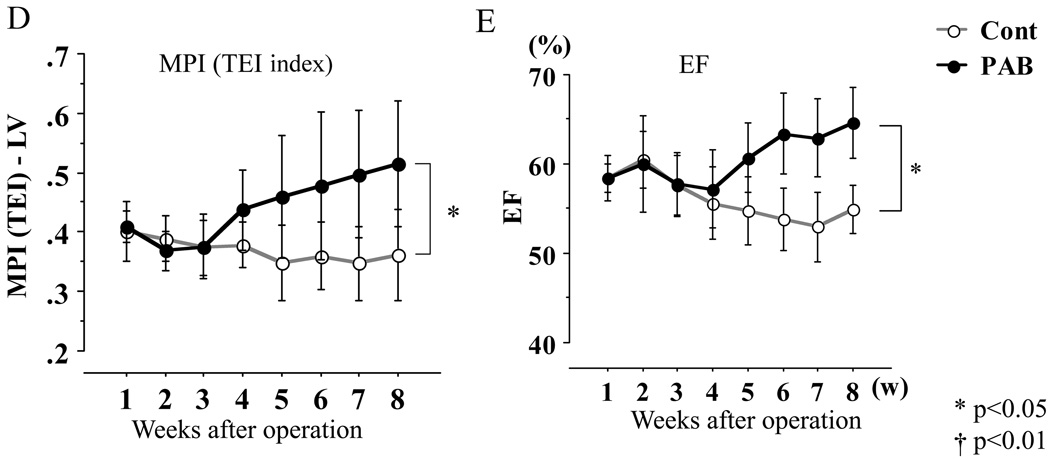
Figure 3. Echocardiographic assessments of LV and septal dimensions and function.
Thickness of the left ventricle (LV; A) and the septum (B): no significant difference was found in LV wall thickness, but that of the septum in the PAB group was significantly thinner than that of the controls. LV chamber dimensions (C) were significantly less in the PAB group than the control group. In the key, (s) refers to end-systole and (d), to end-diastole. The myocardial performance index (MPI), shown in D, increased consistent with progression of LV dysfunction. Ejection fraction (EF) is shown in E, but was likely to be “artifactually” affected by the deformity of the LV as shown in C (see text also). * P<0.05, and †P<0.01 versus the control group.


