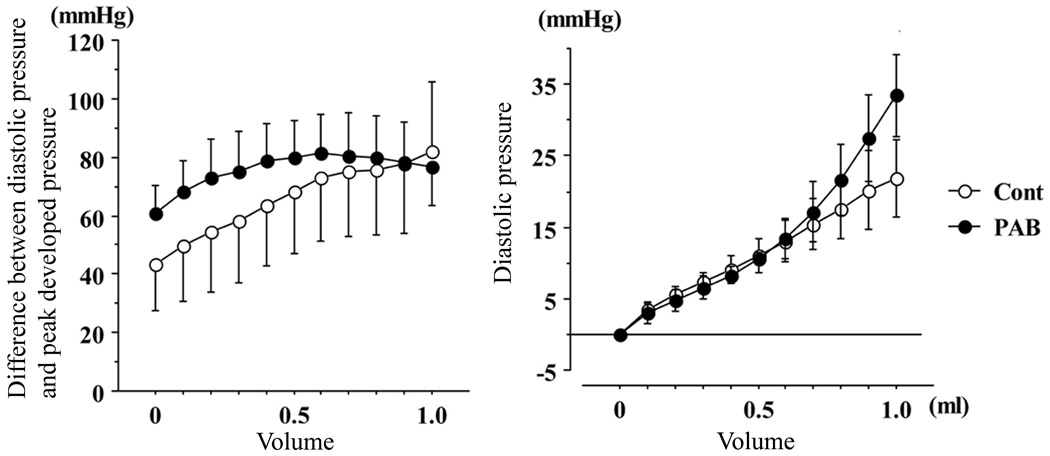
Figure 4. LV systolic and diastolic function estimated in the ex vivo isovolumic Langendorff mode.
The graph on the left shows peak developed LV pressure as a function of LV balloon volume. The graph on the right shows the LV diastolic pressure-balloon volume relationship. The response of LV peak developed pressure tended to be blunted while diastolic compliance, especially at higher LV volumes, was reduced in PAB animals.

