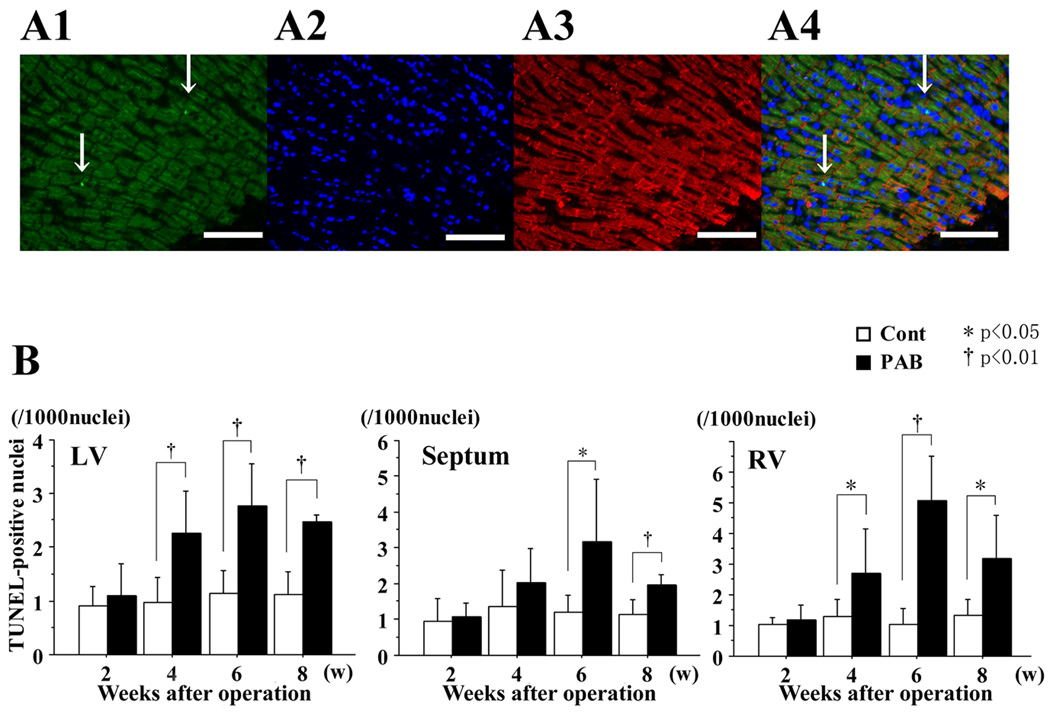
Figure 5. Assessment of apoptosis by TUNEL staining.
A1: TUNEL-positive cells (green fluorescence). A2: DAPI-positive nuclei (blue fluorescence). A3: desmin-positive cells (red fluorescence). A4: color-combined image (all from heart 6 weeks after PAB). Magnification ×200. Arrows indicate TUNEL-positive nuclei. The white scale bar represents 100 microns.
B: Graphs summarize the number of TUNEL-positive nuclei per 1000 cardiomyocyte nuclei, and represent the average from 10 different fields selected randomly. In the septum, more TUNEL-positive nuclei were found in the PAB group than in the control group, especially at 6 weeks after PAB. * P<0.05, and †P<0.01 versus the control group.

