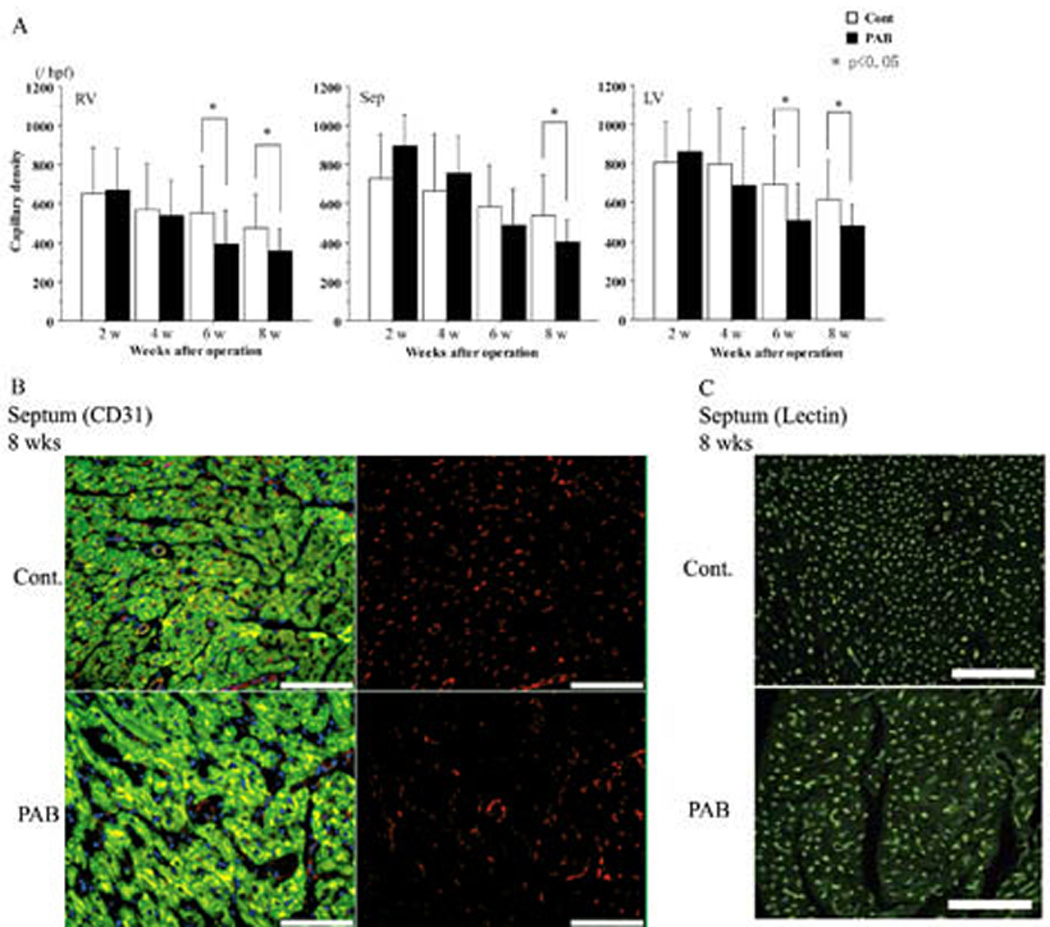
Figure 8. Assessment of alterations in microvascular density.

The graphs in (A) portray differences in the numbers of microvessels stained by CD31 antibody. In the septum at 8 weeks and the LV and the RV at 6 and 8 weeks, microvascular density decreased significantly in the PAB hearts. *p<0.05 versus the control group.
Representative images of CD31 staining are shown in (B); CD 31 staining. Microvessels reacting with antibody to the endothelial cell-specific epitope CD 31 appear in red (on the right); the merged images stained with DAPI (DNA, nuclei, blue) and desmin (muscle, green) are in Panel B on the left. Examples of lectin staining of capillaries in isolated-perfused control (top image) and PAB (bottom image) hearts, visualized as relatively punctuate areas of bright green fluorescence, are shown in (C). For both (B) and (C), magnification ×200; the white scale indicates 100 microns.
