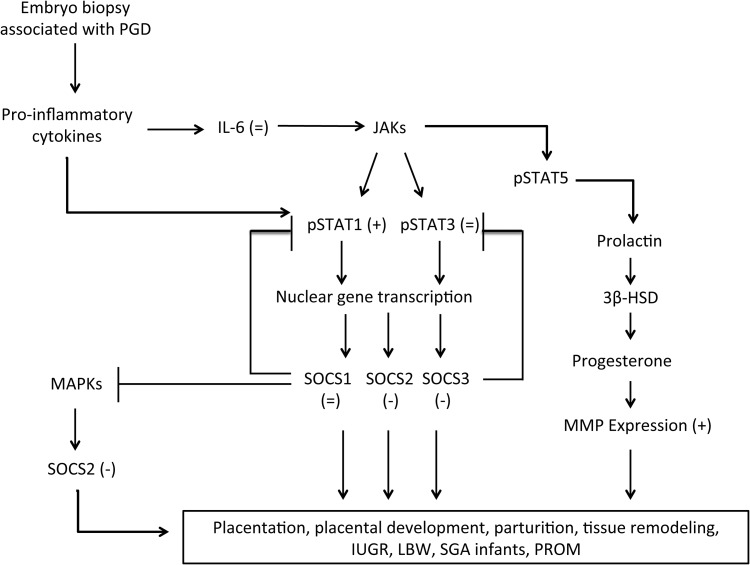
Figure 4.
Schematic diagram showing the inter-related inflammatory SOCS, STAT and MMP signaling pathways. Arrows indicate stimulation and capped lines indicate feed-back inhibition. Bracketed figures in each part of the cascade indicate that blastomere removal caused increases (+), decreases (−) or no change (=), when compared with controls for which the zona pellucida was pierced but blastomere was not removed.

