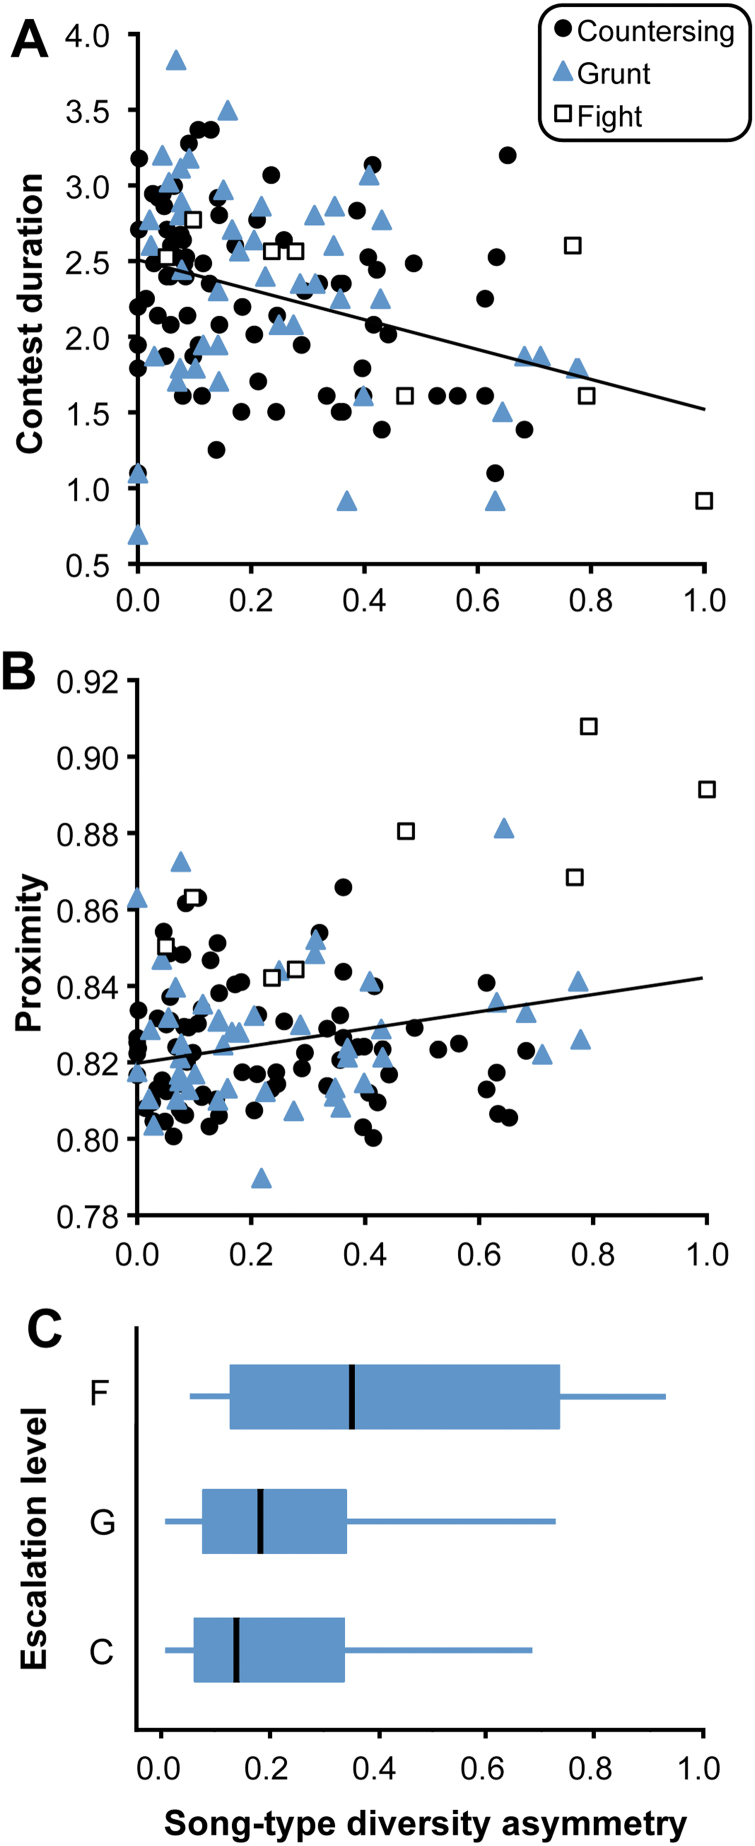
Figure 6.
Three tests of the sequential assessment model predictions: contest duration, proximity of approach, and escalation level as a function of the asymmetry in motivation signaling. (A) Contest duration, measured as mean songs sung per bird during the interaction (ln transformed), is longer and more variable when contestants sing with more similarity in song-type diversity during the interaction, in support of the model. Symbols show contests with different escalation levels (countersinging, grunting, or fighting interaction). Trendline shows least-squares regression fit to all points combined. (B) Proximity of the 2 birds in the During phase (reciprocal of mean distance during the interaction, transformed with a power function) is positively correlated with greater asymmetry in song-type diversity between the birds, which contradicts the model. Symbols and trendline as in (A). (C) Escalation level is positively correlated with asymmetry in song-type diversity. Box and whiskers plot show median (black bar), quartile range (gray box), and 95% quantiles (gray horizontal lines).

