
Figure 7.
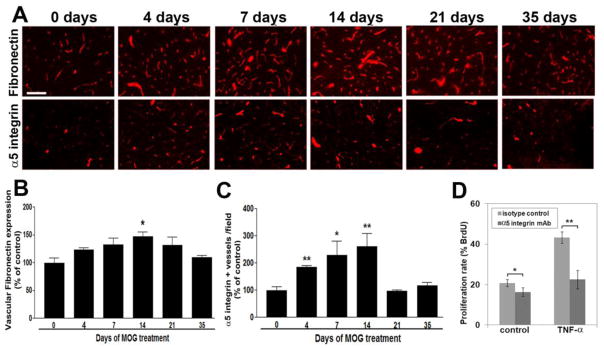
Upregulation of fibronectin and the α5 integrin on remodeling vessels during EAE. A. IF staining of fibronectin and α5 integrin on frozen sections of cervical spinal cord taken from 0, 4, 7, 14, 21, and 35 days post-immunization. Scale bar =100 μm. B. Quantification of vascular fibronectin staining was performed using Volocity software as described in Materials and Methods. Data points represent vascular expression relative to control levels, expressed as the mean ± SEM of 3 experiments. * p < 0.05. C. Quantification of α5 integrin-positive vessels was performed using Volocity software. Data points represent the number of α5 integrin-positive vessels relative to control levels, expressed as the mean ± SEM of 3 experiments. * p < 0.01, ** p < 0.005. Note that vascular expression of fibronectin and the number of α5 integrin-positive vessels increased during EAE development, to reach a peak 14 days post-immunization, and gradually decreased thereafter. D. BEC proliferation plated on fibronectin was examined over 16 hours, and expressed as the % of BEC that incorporated BrdU. All points represent the mean ± SEM of four experiments. Note that TNF-α promoted BEC proliferation, and that functional blockade of the α5 integrin reduced BEC proliferation. * p < 0.05, ** p < 0.005.