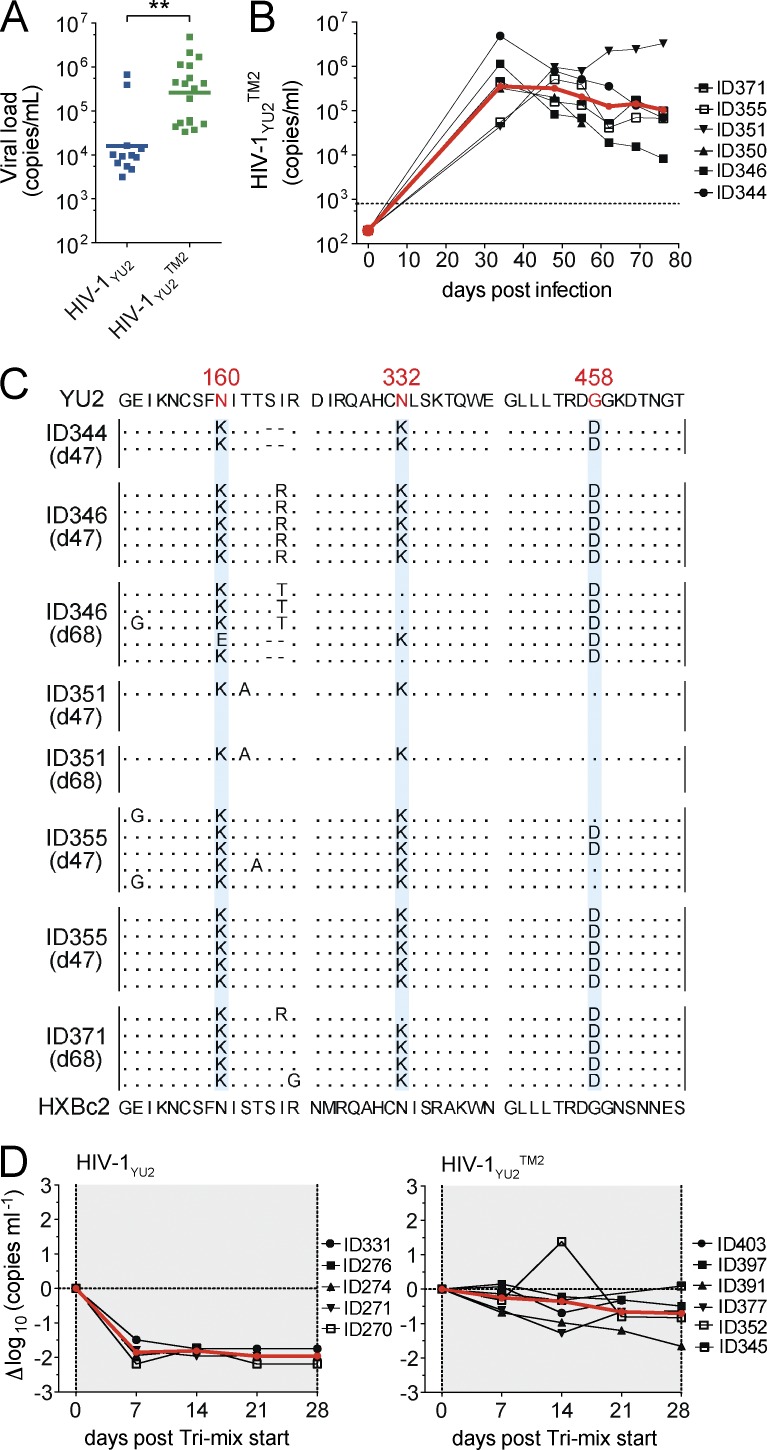
Figure 2.
Infection of humanized mice with HIV-1YU2 triple mutant (HIV-1YU2TM2). (A) Viral loads in humanized mice infected with WT HIV-1YU2 (blue) and HIV-1YU2TM2 (green) at day 34 after infection. P-value was determined using a two-sided Mann-Whitney U test. **, P < 0.001. Plot shows data of 30 infected mice of 1 representative experiment of 2 performed. (B) Graph shows viral RNA copies/ml (y-axis) versus days after infection (x-axis) for HIV-1YU2TM2–infected humanized mice. Each black line represents a single mouse, and the red line represents the geometric mean. (C) env sequence analysis of individual mice that are shown in (B). Time of sequence analysis is indicated in days after infection. (D) Tri-mix (PG16, 3BNC117, 10–1074) therapy in mice infected with HIV-1YU2 (left) and HIV-1YU2TM2 (right). Changes in viral load in Δlog10 (y-axis) plotted against days after infection (x-axis) compared with baseline (day 0). Each black line represents a single mouse and the red line illustrates the mean. Treatment response in mice infected with HIV-1YU2 or HIV-1YU2TM2 was analyzed in parallel in a single experiment and each group consisted of at least five individual mice (D).

