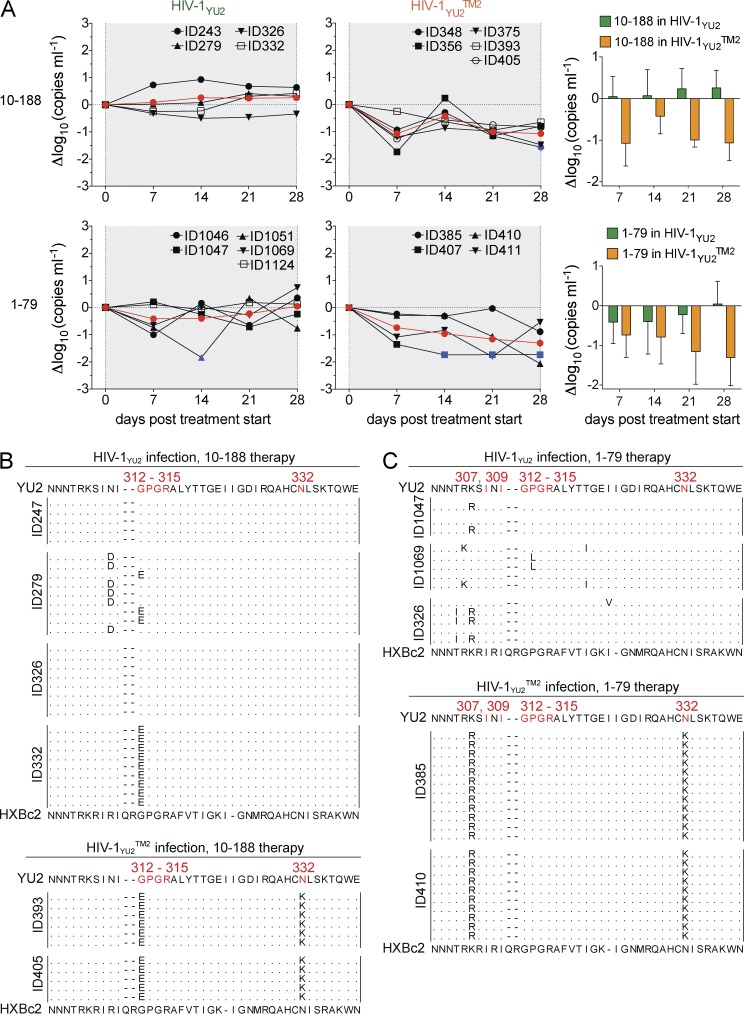
Figure 6.
Suppression of HIV-1YU2TM2 but not HIV-1YU2 viremia by V3-loop antibodies 10–188 and 1–79. (A, left and middle) Graphs show changes in viral load in response to 10–188 or 1–79 treatment in Δlog10 (y-axis) plotted against days after infection (x-axis) compared with baseline (day 0) for mice infected with HIV-1YU2 or HIV-1YU2TM2. Each black line represents a single mouse, and the red line illustrates the mean. Blue colored symbols indicate a viral load measurement below 200 copies/ml. (A, right) Statistical analysis to determine group differences between HIV-1 YU2 (green) and HIV-1YU2TM2 (orange) using repeated measures ANOVA; 10–188, P = 0.003; 1–79, P = 0.032. (B and, C) gp120 sequences obtained from HIV-1YU2– or HIV-1YU2TM2–infected mice treated with 10–188 (B) or 1–79 (C) between days 14 and 28. Residues in HIV-1YU2 (top) were numbered according to HXBc2 (bottom). Treatment response of 10–188 and 1–79 in mice infected with HIV-1YU2 or HIV-1YU2TM2 was analyzed in a single experiment in which each group consisted of at least four individual mice and sequence data were obtained from at least two mice per group.

