Figure 1.
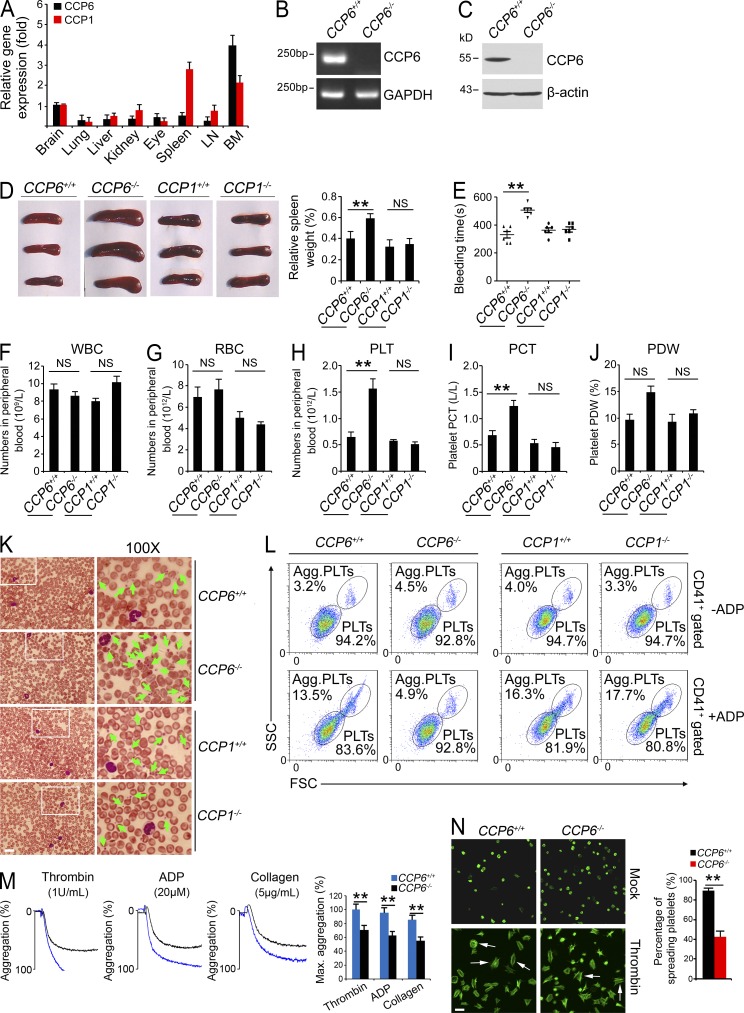
Deficiency in CCP6 and not in CCP1 results in splenomegaly and increased numbers of dysfunctional platelets. (A) CCP6 and CCP1 total RNA was extracted from different tissues and analyzed by real-time qPCR. Relative fold of gene expression values was normalized to endogenous β-actin. Primer pairs are shown in Materials and methods. Results are shown as means ± SD. n = 5. (B and C) BM CCP6 levels were measured by RT-PCR (B) and immunoblotting (C). GAPDH and β-actin were used as loading controls, respectively. (D) Photographs of spleens (left) and relative weight of spleens (right) were obtained. Results are shown as means ± SD. **, P < 0.01. n = 15 for each group. (E) Bleeding times. Results are shown as means ± SD. n = 6. **, P < 0.01. (F–H) Peripheral blood cell counts were obtained for CCP6-deficient, CCP1-deficient, and littermate control mice. F, WBCs; G, RBCs; H, platelets (PLT). (I and J) PCT and PDW were analyzed. For F–J, results are shown as means ± SD, n = 10. **, P < 0.01. (K) Representative peripheral blood smears with Wright’s staining. Magnified images were visualized using an oil-immersion 100× lens. White boxes in left panels are shown in right panels. Bar, 20 µm. Green arrowheads denote platelets. Data were repeated five times with similar results. (L) Mouse CD41+ platelets were stimulated with or without ADP treatment and analyzed by flow cytometry. n = 4 for each group. (M) ADP, thrombin, and collagen-stimulated platelet aggregations were measured by aggregometry in CCP6+/+ and CCP6−/− mice. Typical results for percentages of aggregation (%) are shown and maximum percentages of aggregation (Max. aggregation %) of each condition were calculated. n = 6 for each group. Results are shown as means ± SD. **, P < 0.01. (N) Platelets were treated with thrombin and placed on poly-l-lysine–coated slides for spreading. Representative confocal immunofluorescence images are shown on the left. Bar, 5 µm. White arrows denote typical spreading platelets. Percentages of spreading platelets in different fields were calculated and shown on right as means ± SD. **, P < 0.01. All data are representative of at least four independent experiments.

