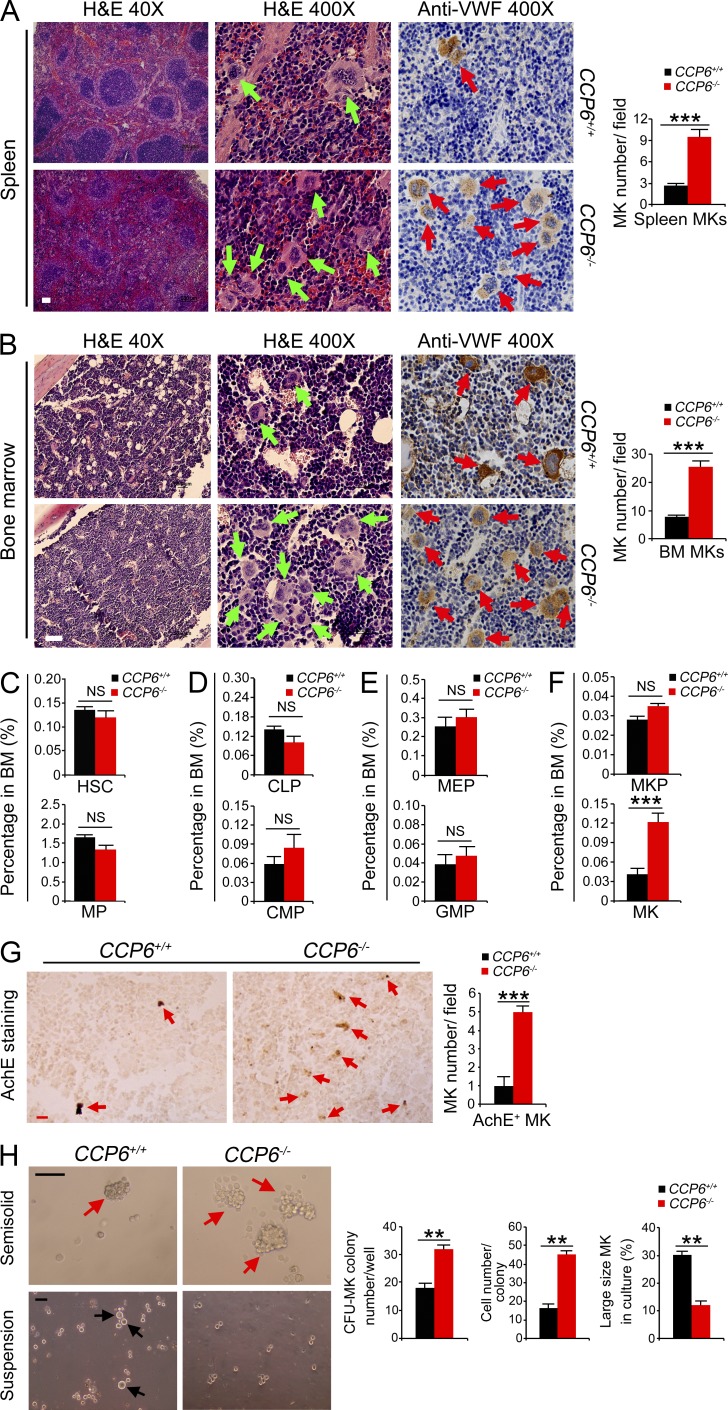
Figure 2.
Deficiency in CCP6 and not in CCP1 causes abnormal megakaryopoiesis. (A and B) Paraffin sections from spleen and femurs of 6-wk-old mice were stained with H&E or anti-VWF antibody (brown)/hematoxylin (blue) by IHC. Bar, 100 µm. Green arrows in left panels and red arrows in right panels denote MKs. MKs in different fields (n = 20 fields) were enumerated (right graphs). Results are shown as means ± SD. ***, P < 0.001. (C) Flow cytometry analysis of HSCs (Lin−Sca-1+c-Kit+/LSK) and myeloid progenitors (Lin−c-Kit+Sca-1−) from BM. (D) Flow cytometry analysis of CLPs (Lin−CD127+Sca-1lowc-Kitlow) and CMPs (Lin−c-Kit+Sca-1−CD34+CD16/32−) from BM. (E) Flow cytometry analysis of MEPs (Lin−c-Kit+Sca-1−CD34−CD16/32−) and GMPs (Lin−c-Kit+Sca-1−CD34+CD16/32+) from BM. (F) Flow cytometry analysis of MKPs (Lin−c-Kit+CD41+) and MKs (Lin−c-Kit−CD41+) from BM. n = 10 for each group. Results are shown as means ± SD. ***, P < 0.001. (G) Paraffin sections of BM-containing MKs were stained for AchE by IHC (left). AchE+ cells represent all MKs. Red arrows denote MKs. Data are representative of at least three separate experiments. Bar, 20 µm. Total numbers of AchE+ cells were enumerated in the right graph (n = 20 fields). Results are shown as means ± SD. ***, P < 0.001. (H) In vitro MK development assays from sorted BM MKPs using MethoCult semisolid media for CFU-MK formation (top left) and liquid suspension media for large size MK maturation (bottom left). Representative microscopy images are shown (left). Bar, 100 µm. Red arrows in top left denote CFU-MK colony and black arrows in bottom left denote large size MKs. 1 × 10² sorted MKPs from BM of the indicated mice were mixed with 1 ml MethoCult media and plated on a 35-mm dish for incubation. MK colonies were enumerated and the colony types of MKs were confirmed by AchE staining. CFU-MK assays from total BM cells (5 × 10⁴) were also performed and displayed similar results (not depicted). Data are representative of at least three separate experiments. n = 5 for each group. Cell numbers were enumerated as specified (right graphs). Results are shown as means ± SD. **, P < 0.01.

