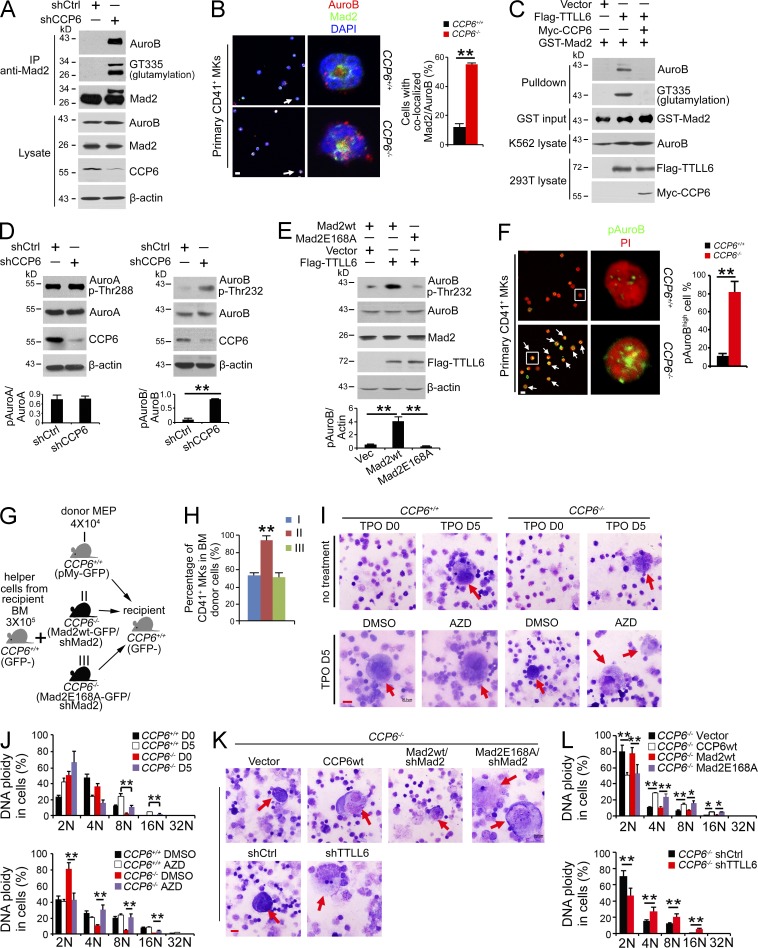
Figure 6.
CCP6 deficiency causes Mad2 hyperglutamylation, promoting Aurora B hyperactivation with generation of dysplastic MKs. (A) Assessment of Mad2 polyglutamylation and association with Aurora B upon CCP6 silencing (shCCP6) in an immunoprecipitation assay (shCtrl as control). K562 lysates were immunoprecipitated with anti-Mad2 antibody followed by immunoblotting. (B) Assessment of Mad2 colocalization with Aurora B (AuroB) in primary CD41+ MKs. Representative confocal images are shown (left: Aurora B, red; Mad2, green; nucleus, blue. Bar, 5 µm). 50 primary CD41+ cells were analyzed for each condition. In left panels, arrows point to cells shown in right panels. White arrows denote colocalization of Mad2 with Aurora B. Pearson’s correlation coefficient (PCC) between Mad2 and Aurora B of each cell was calculated by ImageJ and colocalization was identified as PCC rate ≥ 0.5. Percentages of colocalized cells are shown as means ± SD. **, P < 0.01 (right graph). (C) Assessment of polyglutamylated Mad2 association with Aurora B by GST pulldown assays. rGST-Mad2 was incubated with lysates from 293T cells transfected with Flag-TTLL6 and Myc-CCP6 at 37°C for 2 h, followed by GST pulldown in K562 cell lysates. (D) Assessment of Thr232 phosphorylation of Aurora B and Thr288 phosphorylation of Aurora A upon CCP6 silencing (shCCP6; shCtrl as control). K562 lysates were analyzed by immunoblotting with anti-Aurora B, anti–Thr232-Aurora B, anti–Aurora A, and anti–Thr288-Aurora A antibodies (top). Ratios of pThr/Aurora kinase were calculated and shown as means ± SD. **, P < 0.01 (bottom graph). (E) Assessment of Thr232 phosphorylation of Aurora B in the presence of an E168A Mad2 mutant. Flag-TTLL6, pMY-Mad2-wt and pMY-Mad2-E168A vectors were transfected into 293T cells, followed by immunoblotting (top). Ratios of pAurora B/actin were calculated and shown as means ± SD. **, P < 0.01 (bottom graph). (F) Assessment of Thr232 phosphorylation of Aurora B in CCP6-deficient MKs. Representative confocal images are shown (left). Phospho-Thr232 of Aurora B (pAuroB), green; nucleus, red. Bar, 5 µm. The percentage of cells with high phospho-Thr232 of Aurora B (pAuroBhigh) was quantitated in >50 primary CD41+ cells for each group and shown as means ± SD. **, P < 0.01 (right graph). White boxes in left panels are shown in right panels. White arrows denote pAuroBhigh MKs. The fluorescence intensity of pAuroB in each cell was calculated by ImageJ and pAuroBhigh was identified as higher intensity than the mean fluorescence intensity in the CCP6+/+ group. (G) Schematic representation of transplantation. (H) Mad2 silenced BM MEPs from CCP6+/+ or CCP6−/− donor mice were rescued with pMY-Mad2-wt or pMY-Mad2E168A together with BM helper cells, and then transplanted into irradiated recipients. BM MKs of recipients were analyzed 12 d after transplantation. n = 6. Percentages of CD41+ MKs are shown as means ± SD. **, P < 0.01. (I and J) Primary MKPs were treated with the Aurora B inhibitor AZD-1152, and then stimulated with 20 ng/ml TPO for 5 d. Cell morphology was analyzed by Giemsa staining (Bar, 20 µm; red arrows denote mature MKs; n = 6; I). DNA contents were analyzed by flow cytometry. Percentages of DNA ploidy are shown as means ± SD. **, P < 0.01 (J). (K and L) Primary MKPs were infected with the indicated retrovirus then stimulated with 20 ng/ml TPO for 5 d. Cell morphology was analyzed by Giemsa staining (Bar, 20 µm; red arrows denote mature MKs; n = 6; K). DNA contents were analyzed by flow cytometry. Percentages of DNA ploidy are shown as means ± SD. *, P < 0.05; **, P < 0.01 (L). Data represent at least three separate experiments.

