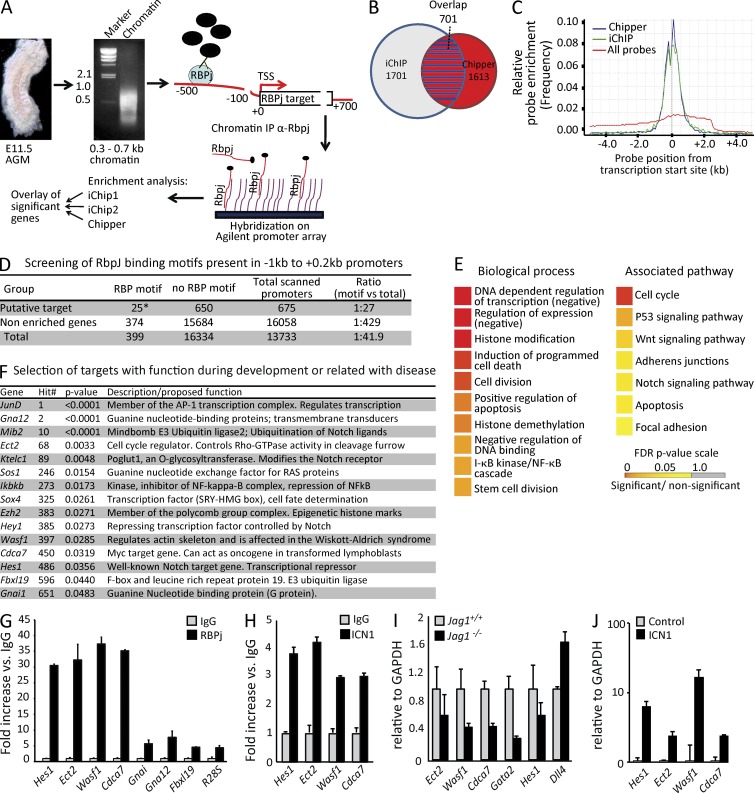
Figure 1.
ChIP-on-chip analysis of E11.5 AGMs. (A) Schematic representation of the ChIP-on-chip procedure. (B) 701 overlapping promoter regions (red with blue stripes) between iChip (blue circle) and Chipper (red circle) software were identified. (C) Comparing the relative probe enrichment of identified RBPj targets by Chipper and iChip to all probes. (D) RBPj-binding motif scanning (TGGGAAANT) in a range of −1 to 2 kb from the TSS showed significantly more binding sites in the 675 promoter regions with an Ensembl ID than all of the promoter regions (*, P = 0.021; χ2 = 5.259). (E) GO biological process (GO-BP) and pathway (KEGG) analysis in the 676 overlapping group. (F) Selection of putative RBPj targets showing the gene symbol, hit number, and enrichment p-value. (G) qPCR analysis for RBPj recruitment to the selected genes in an independent ChIP from E11.5 AGMs (n = 3). (H) Recruitment of ICN1 to the selected genes, assessed by ChIP from E11.5 AGMs (n = 3). (I) qRT-PCR analysis on cDNA of E10.5 dissected AGMs from Jag1+/+ and Jag1−/− embryos from confirmed ICN1 and RBPj target genes (Ect2, Wasf1, and Hes1); Gata2 and Dll4 are shown as controls (n = 4). (J) A pool of six E10.5 AGMs from Jag1−/− was disrupted with collagenase and cultured. In this culture ICN1-IRES-GFP was transduced, and after 1 wk, infected cells (GFP+) were sorted and the indicated genes were analyzed by qRT-PCR (n = 3). Error bars represent the SD.

