Figure 3.
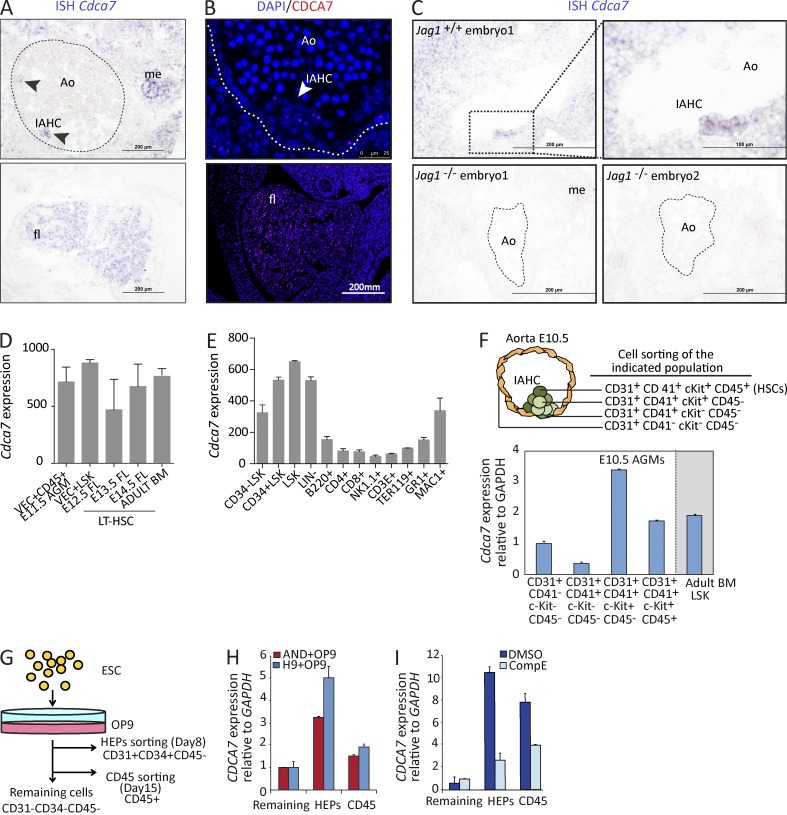
Cdca7 is expressed in mouse and human embryonic hematopoietic progenitor cells. (A) ISH of Cdca7 on E10.5 embryos. Arrowheads indicate hematopoietic clusters in the top panel. Fetal liver (fl) staining is shown in the bottom panel. (B) E11.5 embryo immunofluorescence is shown. (C) ISH comparing E10.5 Jag1+/+ with Jag1−/− embryos. Dashed lines indicate the aortic endothelium and bars indicate the scale. Ao, aorta in the AGM region; IAHC, intraaortic hematopoietic cluster; me, mesonephros. (D–F) Cdca7 expression from the indicated purified populations from the embryo to the adult. (D and E) Gene expression from purified HSCs obtained from E11.5 AGM (VEC+CD45+), E12.5 FL (LSK), and LT-HSCs from adult BM (CD150+CD48−LSK) and different subpopulations of hematopoietic progenitors and mature cells. Data are derived from public databases. (F) Cdca7 expression on purified E10.5 AGM subpopulations and adult BM LSK. (G) Experimental design of hESC hematopoietic differentiation on OP9. (H and I) HEPs (CD31+CD34+CD45−) and CD45+ hematopoietic differentiated cells were sorted and analyzed by qRT-PCR relative to nonhematopoietic remaining cells (CD31−CD34−CD45−). Cdca7 expression was determined by qPCR (n = 3). Error bars represent the SD.

