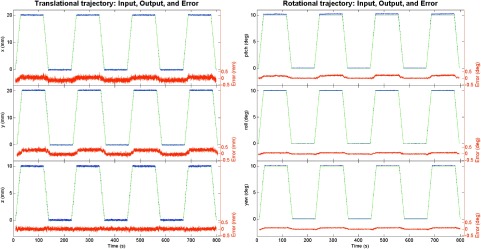
FIG. 3.

Comparison between input (ideal, no noise) and output (recorded, with noise) translational motions for 20 mm in X (top left) and Y (center left) and 10 mm in Z (bottom left), with resultant RMSE values of 0.14, 0.22, and 0.08 mm, respectively. Rotationally, a comparison was made for 10° in pitch around X (top right), roll around Y (center right), and yaw around Z (bottom right), with resultant RMSE values of 0.16°, 0.06°, and 0.08°, respectively. Below the comparison plot is the difference between the intended input trajectory and the measured output trajectory.
