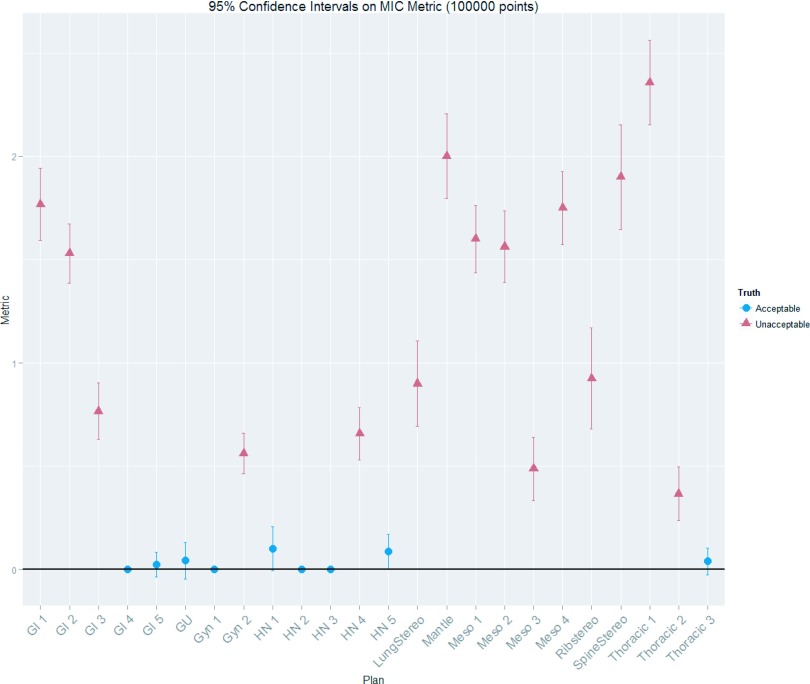
FIG. 3.
Multiple ion chamber metrics for each of the 24 IMRT QA plans investigated with 95% confidence intervals. This figure displays the combined results of the MIC measurements for each plan. The shape of the points shows whether the plan was ultimately sorted as acceptable or unacceptable. It can be seen from this figure that the acceptable plans all had MIC metrics close to zero; zero indicating a plan whose ion chamber measurements all had dose differences of less than ±3% from the tps planned value.

