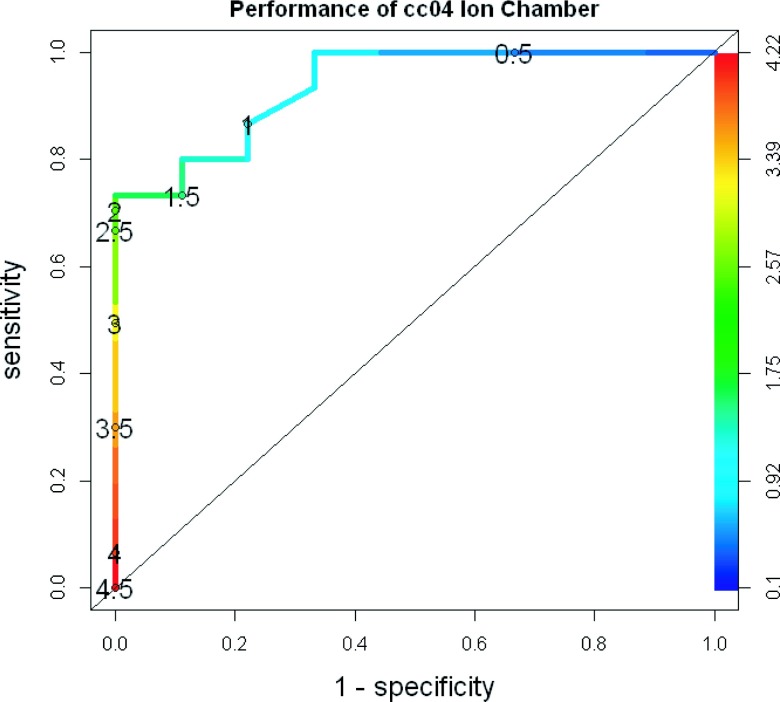
FIG. 4.
ROC curve for the cc04 ion chamber. This plot shows how the ROC curve is generated by varying the cutoff values from more to less stringent. The percent dose difference cutoff values used to create the curve are numerically printed on the curve and also indicated by a shading gradient, with the bottom left being the least stringent and the top right being the most.

