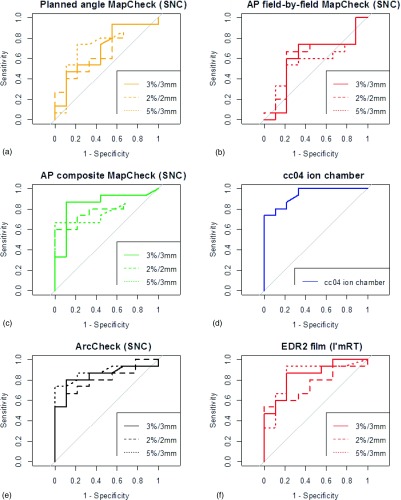
FIG. 5.
ROC curves generated for each analysis, grouped by dosimetric system. For each planar or array dosimeter, each panel contains a ROC curve for 2%/2 mm, 3%/3 mm, and 5%/3 mm as the criteria for the gamma analysis. For this figure, all MapCheck gamma analyses were performed using snc Patient software.

