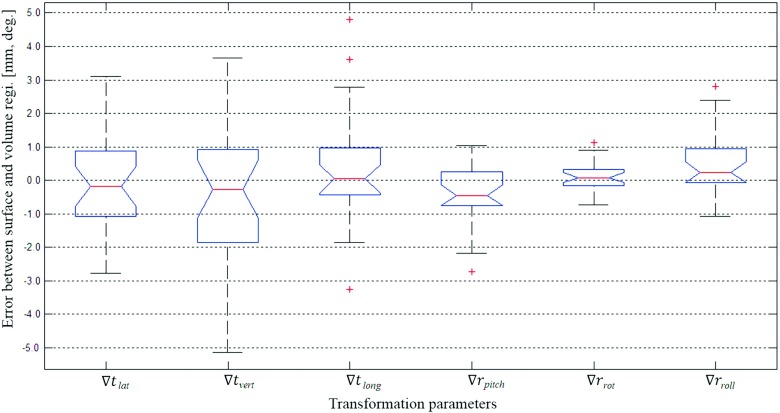
FIG. 4.
Deviations of the surface registration compared to the volumetric registration, where ∇T = (Ts − Tv), (∇tlat, ∇tvert, ∇tlong, ∇rpitch, ∇rrot, ∇rroll) = (ts,lat − tv,lat, ts,vert − tv,vert, ts,long − tv,long, rs,pitch − rv,pitch, rs,rot − rv,rot, rs,long − rv,long). The central box represents the central 50% of the data (its lower and upper boundary lines are at the 25% and 75% quantile). The central line in the box indicates the median of the data, and the cross marks are the outlier data.

