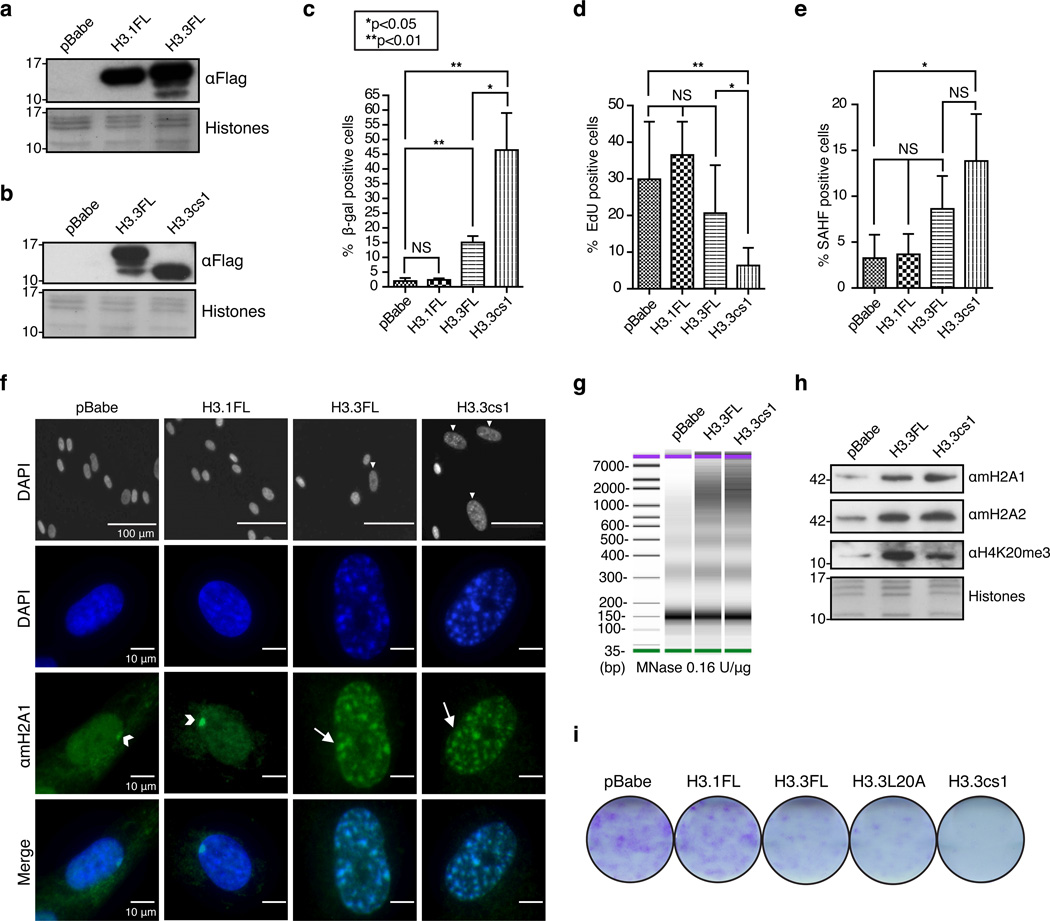
Figure 3. Ectopic expression of H3.3 and H3.3cs1 induces senescence in fibroblasts.
(a) & (b) Immunoblot of IMR90 cells stably expressing full length H3.1 (H3.1FL), full length H3.3 (H3.3FL), cleaved H3.3 (H3.3cs1) or empty pBabe vector with αFlag. Core histones stained with Amido Black for loading. Note the H3 cleavage products in H3.3FL-expressing cells. (c) Quantification of β-Gal positive cells in IMR90 cells expressing the indicated histones; mean ± s.d. (n=3 biological replicates). (d) Quantification of EdU incorporation; (n=3 biological replicates). (e) Quantification of SAHF; mean ± s.d. (n=3 biological replicates); p-values for c–e are as indicated; two-tailed unpaired Student’s t-test. (f) (Top) DAPI stained nuclei of IMR90s expressing the indicated histones. Scale bars as shown. (Middle) Immunofluorescence of IMR90s expressing the indicated histones stained with DAPI and αmacroH2A1. Arrowheads indicate Xi and arrows indicate SAHF. (Bottom). Merged images of DAPI and αmacroH2A1. Images taken at 40× magnification (g) Nuclei obtained from IMR90s expressing the indicated histones were digested with MNase at 0.16 units per ug of chromatin. DNA was isolated after MNase digestion and analyzed by high sensitivity DNA assay (Agilent 2100 Bioanalyzer). (h) Chromatin fraction from IMR90 cells expressing pBabe, H3.3FL and H3.3cs1 probed with the indicated antibodies. Core histones stained with Amido Black for loading. (i) Colony formation assay course (day 16 post-infection) of IMR90s expressing the indicated histones.

