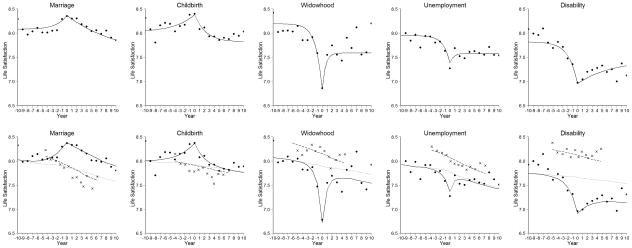
Figure 2.
Top panel: Estimated life satisfaction trajectories from the traditional models, for people who experienced a major life event during the study. Dots show mean life satisfaction in the data. Year 0 is the year of marriage. Bottom panel: Estimated life satisfaction trajectories for the event groups (solid black lines) and the comparison groups (dashed black lines). Gray lines represent what the predicted life satisfaction trajectories would be for people who experienced a life event if they did not experience that event but had same initial level of life satisfaction and experienced normative life satisfaction change over time. Year 0 is the year in which the event occurred. The lines are not straight because year of event varies across people. Dots show mean life satisfaction of the married group in the data. Exes show mean life satisfaction of the comparison group in the data. Comparison group data were plotted by matching each year of participation in the study (in the comparison group) with the average number of years from marriage for that year of participation (in the marriage group).

