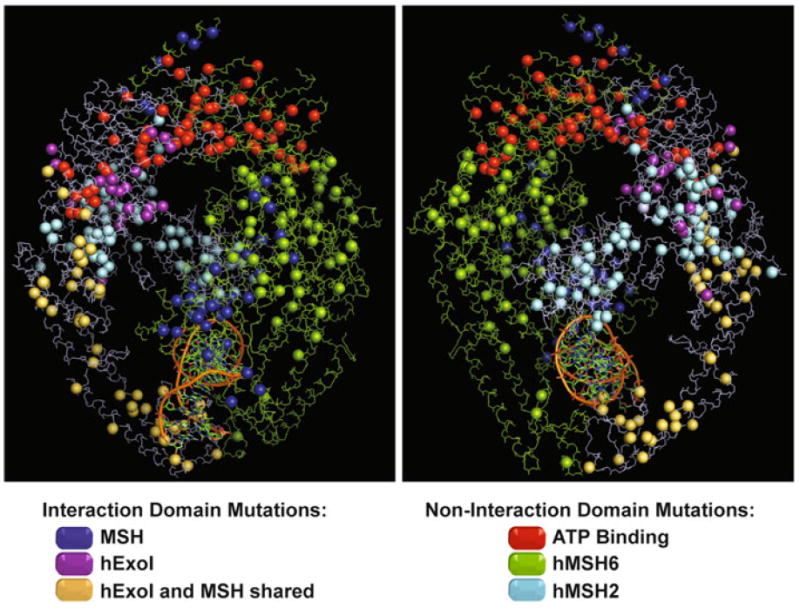
Fig. 2.

Spatial distribution of missense mutations described in the hMSH2-hMSH6 protein complex. The hMSH2 and hMSH6 proteins are delineated in blue and green respectively. Missense mutations are shown as spheres. Mutations located in the ATPase domain are represented in red. Mutations located in the interaction domain between both proteins are marked in dark blue. Mutations in hMSH2 protein located in the interaction region only with hEXO1 are purple and mutations located in the shared interaction region with hEXO1 and hMSH6 are represented in yellow (See Fig. 1). Other mutations are colored based on the protein color where it is found
