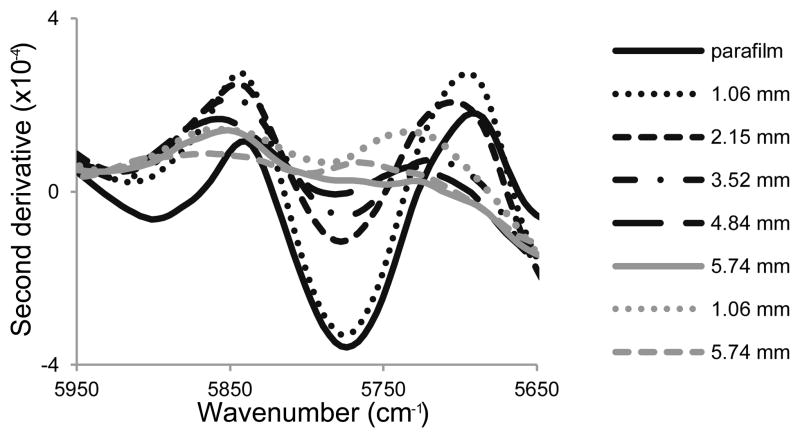
Fig. 1.
Second derivative (third order polynomial, 170 cm−1 window) near infrared spectra of parafilm and cartilage sections of varying thickness, with (black spectra) and without (grey spectra) an underlying layer of parafilm. Evidence of parafilm was observed when the overlying layer of cartilage was less than 5 mm. The parafilm spectrum has been divided by a factor of 6 so that the 5774 cm−1 peak is on the same scale.

