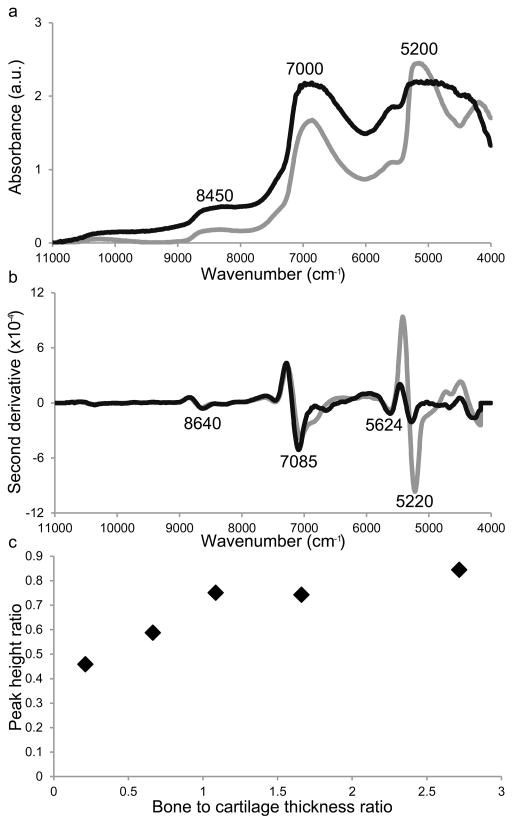
Fig. 2.
(a) Baseline offset corrected and (b) second spectra derivative (third order polynomial, 355 cm−1 window) near infrared spectra of bone (grey) and cartilage (black). The NIR spectra were collected from bone and cartilage samples that were 3.56 and 3.52 mm thick respectively. (c) The peak height ratio of 5270 (free plus bound water) to 7085 cm−1 (free water) as determined from the second derivative spectra of samples with varying amounts of bone and cartilage.

