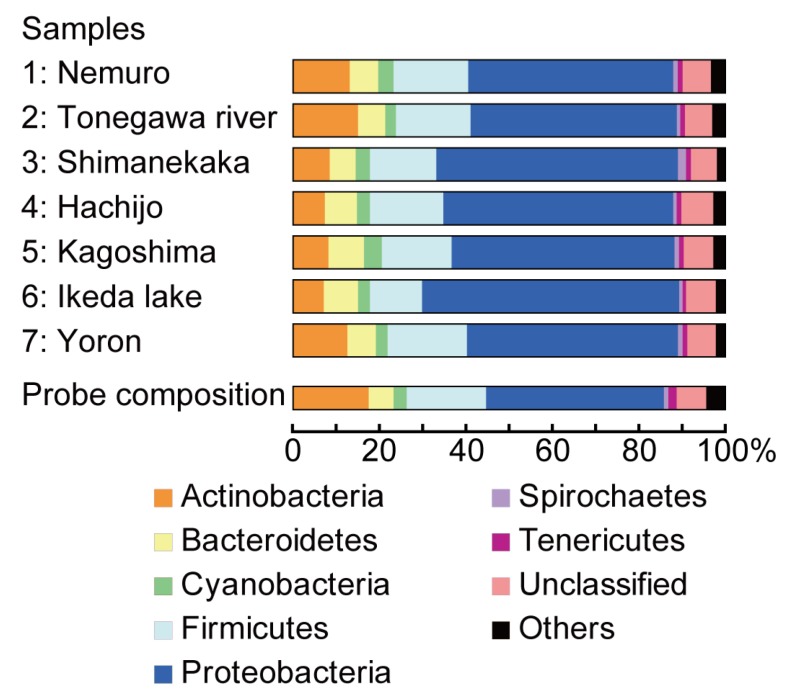
Figure 2.
.Microarray data classified at the phylum level. The percentage of each phylum comprising the microarray probes and the top 1,000 target sequences from each samples 1–7. The actual percentage in each phylum including those for classified as “others” were shown in Table S1. p = 10−8 as evaluated by the proposed algorithm [12].

