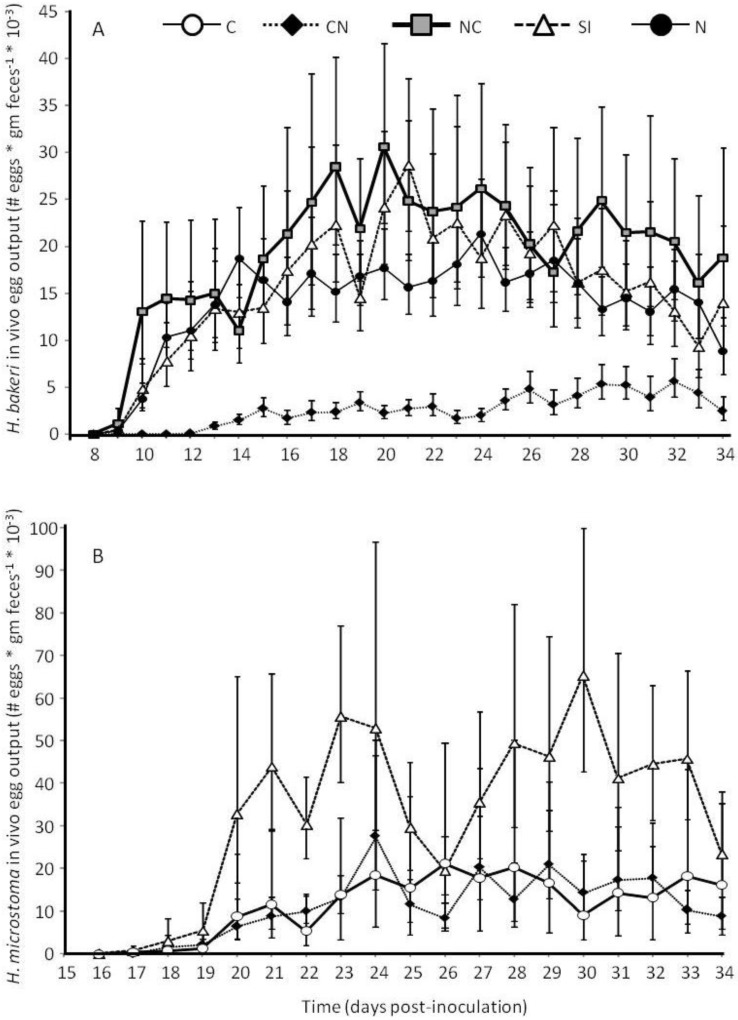
Figure 4.
In vivo fecal egg output for the nematode Heligmosomoides bakeri (A) and the cestode Hymenolepis microstoma (B) from mice in different treatment groups in Experiment 2 (C: cestode only; CN: cestode then nematode; NC: nematode then cestode; SI: simultaneous inoculation; N: nematode only). Values are means (backtransformed from Log10 (egg output + 10)) ± 1 standard error.

