
Figure 4.
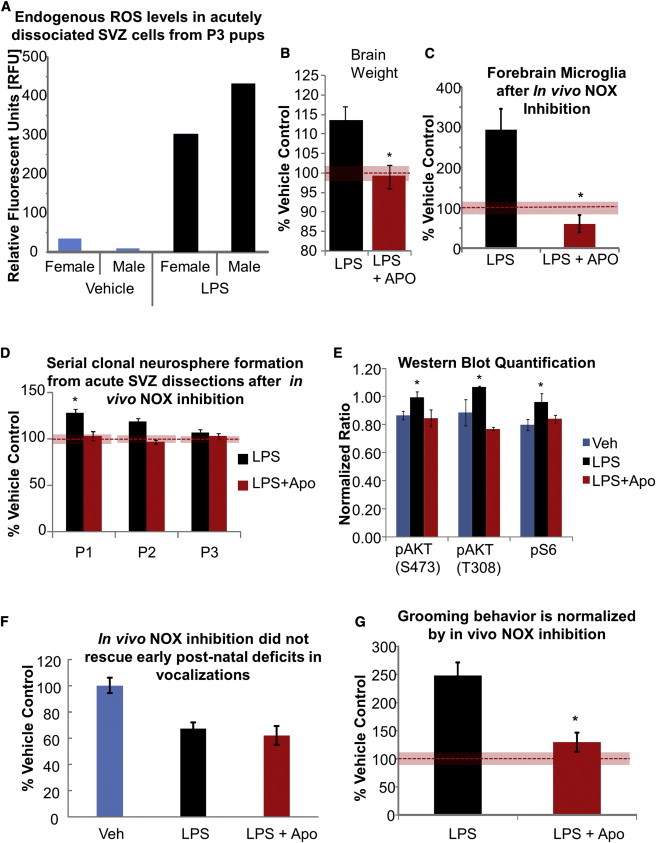
MIR-Exposed Pups Have Dysregulated SVZ ROS Levels, which Contributes to Brain Overgrowth
(A) Endogenous ROS levels in SVZ cells measured by DCFDA dye on P3 (results are pooled samples of three or four mice per group).
(B) Brain weights (corrected for body weight) of MIR-exposed pups with and without NOX inhibition (APO) expressed as a percentage of vehicle controls.
(C) IBA1+ microglia present at birth in the forebrain of MIR-exposed pups with and without NOX inhibition, determined by FACS acquisition and expressed as a percentage of vehicle controls.
(D) Mean number of clonal neurospheres from the SVZ of MIR-exposed pups as a percentage of vehicle control at each passage indicated.
(E) AKT and S6 activation (mean intensity normalized to beta-actin signal) in SVZ cells from MIR-exposed pups with and without in vivo NOX inhibition measured at birth by western blot (n = 3 per group).
(F) Duration of ultrasonic vocalizations of treated and control pups (n = 6 per group). Results are the mean percent vehicle controls.
(G) Grooming duration in MIR-exposed offspring with and without NOX inhibition. Results are the mean percent vehicle controls, n = 16 per group. Unless specified, all data are from n = 3 litters of 10–18 pups each; ∗p < 0.05. All data are presented as mean ± SEM. The red bars indicate the SEM of the normalized control data.