
Figure 2.
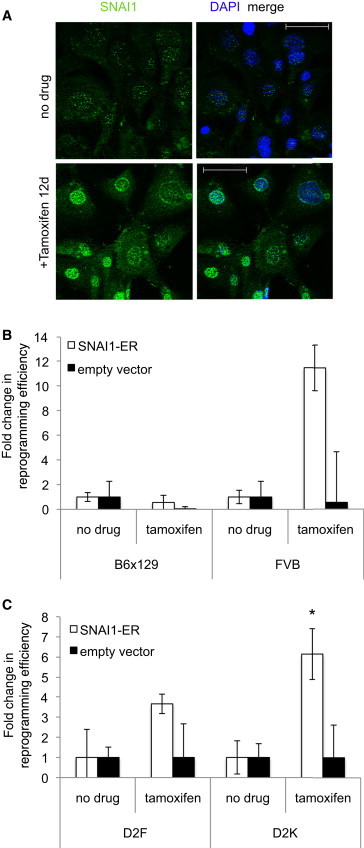
Overexpression of SNAI1 via ER Fusion Improves Reprogramming Efficiency
(A) A B6×129 line expressing SNAI1-ER was created by retroviral transduction. Cells were treated with TMX for 12 days and fixed and labeled. With (lower) or without induction (upper); SNAI1 labeling, green; DAPI, blue; 40×, scale bar represents 50 μm.
(B) Mouse fibroblasts of indicated strain were reprogrammed and efficiency calculated based on colony morphology and SSEA-1 labeling.
(C) D2F or D2K were reprogrammed as in B and Tra 1-60+ colonies labeled. (B and C) White bars, SNAI1-ER; black, empty vector; fold increase over no TMX is shown. n = 3–14, 2–6 biological replicates. Error bars in (B) and (C) show SEM. ∗p < 0.05.
See also Figure S2.