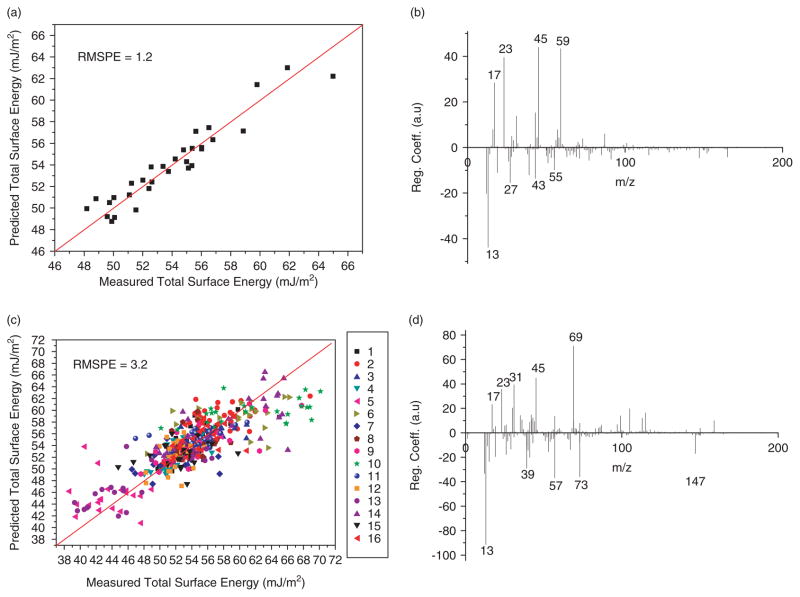
Figure 3.
A–D, measured versus predicted surface energy and regression coefficient versus m/z is shown for each PLS model. PLS models constructed using (a) and (b) 31 polymers (major monomer 1); and (c) and (d) 336 polymers (minor monomers). X = Y lines are provided to guide the eye. This figure is available in colour online at www.interscience.wiley.com/journal/sia.

