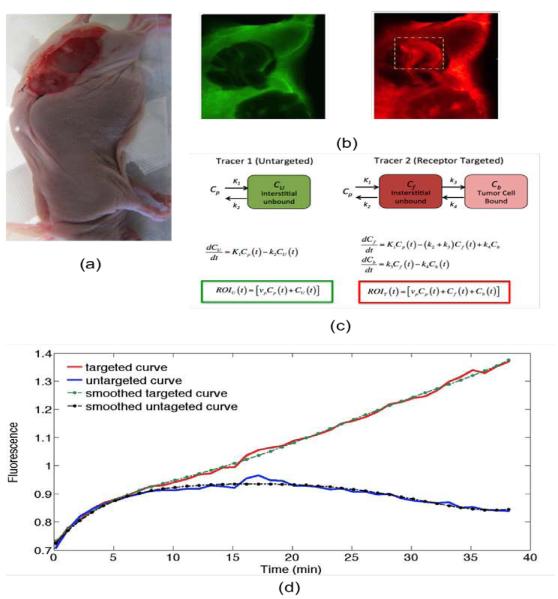
Figure 1.
A photograph of the dual-tracer experimental setup of a U251 mouse with tumor exposed is presented in (a): targeted tracer (red) and untargeted tracer (green) fluorescence uptake images at 60 min post-tracer injection are presented in (b). The tumor area has been marked by the dashed rectangle (b), and the corresponding compartment models (c). ROIT(t) and ROIU(t) represent the measured uptake curves of the targeted and untargeted tracers, respectively, in any region of interest, as a function of time, t; vp is the blood volume percentage in the tumor; K1 and k2 are the rates of exchange of the tracers from the blood concentration (Cp) to the interstitial space (Cf for the targeted tracer and CU for the untargeted tracer) and back, respectively; and k3 and k4 are the rates of association and dissociation of the targeted tracer to its receptor in a bound state (Cb). Typical uptake curves of the targeted tracer (red) and the untargeted tracer (blue) in a single pixel in a low signal-to-noise scenario is presented in (e). The smooth “fits” are polynomials fit to the data to determine the noise characteristics.

