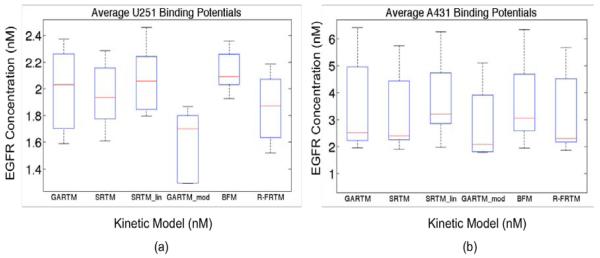
Figure 2.
Box plots of epidermal growth factor (EGFR) concentration estimates from all models are presented in (a) for the human glioma xenograft mice (U251 cell line) and in (b) for the human epidermoid xenograft mice (A431 cell line). The kinetic models are the graphical analysis reference tissue model (GARTM), the simplified reference tissue model (SRTM), the linearized-SRTM (SRTM_lin), a modified GARTM (GARTM_mod), a basis function model (BFM), and a “reduced” full reference tissue model (R-FRTM). The red lines represent the median EGFR concentration estimates.

