
Figure 6.
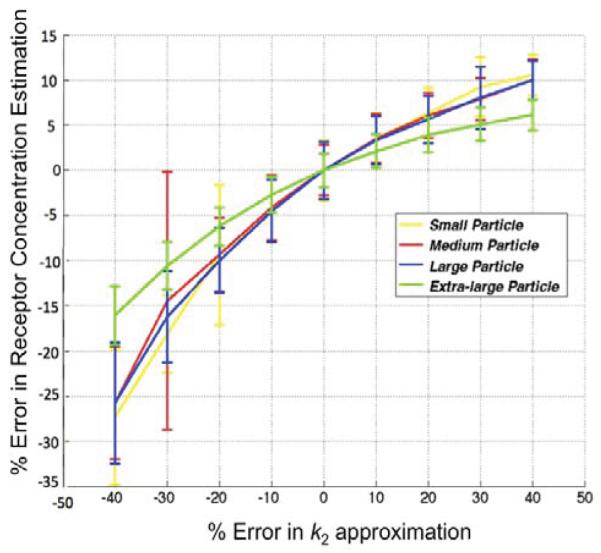
Sensitivity of the results of the graphical analysis reference tissue model (GARTM) to errors in the value of k2. The true k2 is 0.13 in this case and the noise added to the curves is 3%.
Official websites use .gov
A
.gov website belongs to an official
government organization in the United States.
Secure .gov websites use HTTPS
A lock (
) or https:// means you've safely
connected to the .gov website. Share sensitive
information only on official, secure websites.
Sensitivity of the results of the graphical analysis reference tissue model (GARTM) to errors in the value of k2. The true k2 is 0.13 in this case and the noise added to the curves is 3%.