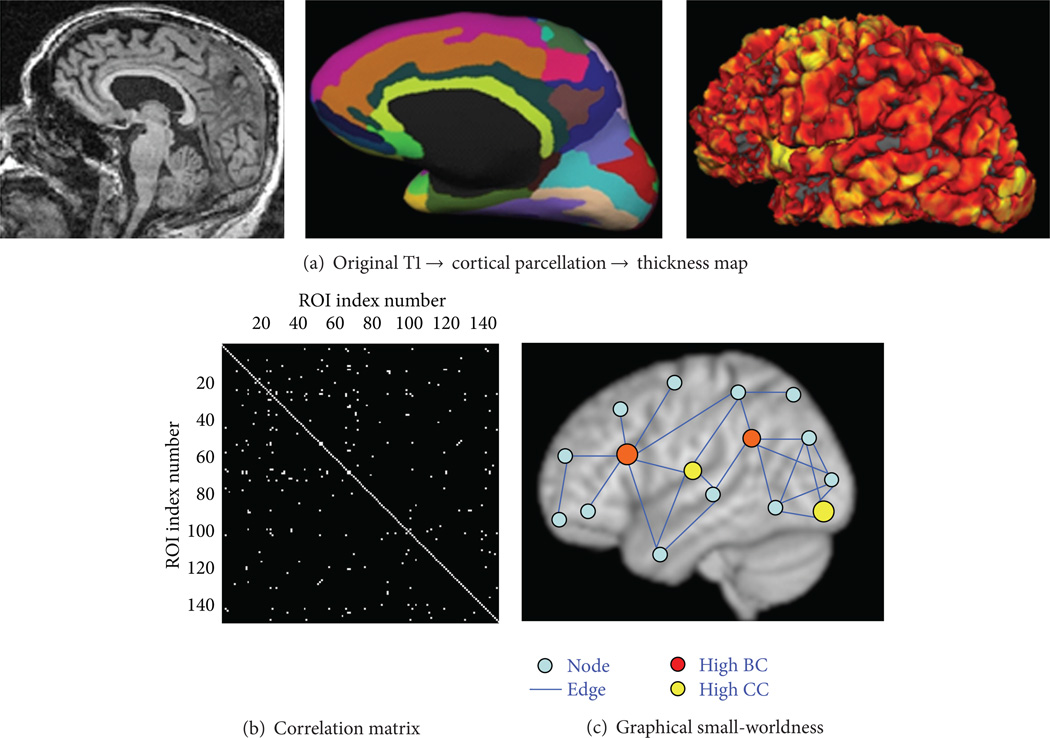
Figure 1.
(a) The original T1 of each subject was processed with Freesurfer software to derive cortical parcellation (148 cortical ROIs) based on normalized template. The thickness map generated in Freesurfer was projected on the surface to derive the average cortical thickness of each ROI (in mm unit). (b) For each group, the thickness vectors of each ROI that consists of the thickness of all subjects within that group were derived. And the Pearson’s correlation between the thickness vectors of every two ROIs (interregional correlation) was computed and applied with a threshold with P < 0.05 (different r values based on the number of subjects in each group) to derive the correlation matrix. (c) The graphical topology of the binarized correlation matrix. Each ROI was denoted as node and each suprathreshold connectivity based on thickness vectors was denoted as edge. The nodes at the center of the graph with a “star-” shape-like edges have high betweenness centrality (BC), shown in red color, while the nodes in the center of the local cluster (satellite) have high clustering coefficient (Cp), shown in yellow color.

