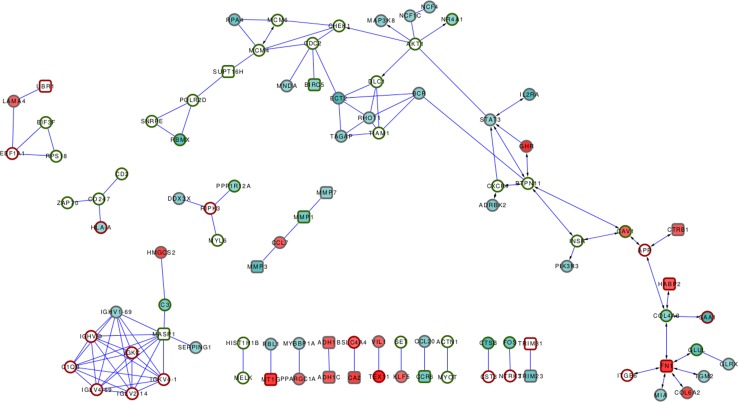
Fig. 2.
Network of ZNP interactions extracted from the microarray experiments of Noble et al. (2010). Genes are represented by nodes and interactions by edges. Green-colored nodes indicate down-regulated genes, red color variations refer to up-regulated genes. Border colors indicate genes modulated in CD versus control tissues. Fill colors correspond to genes modulated in inflamed versus non-inflamed CD tissues. Arrows point at pairs of ZNP network proteins whose direct interaction is annotated in public databases

