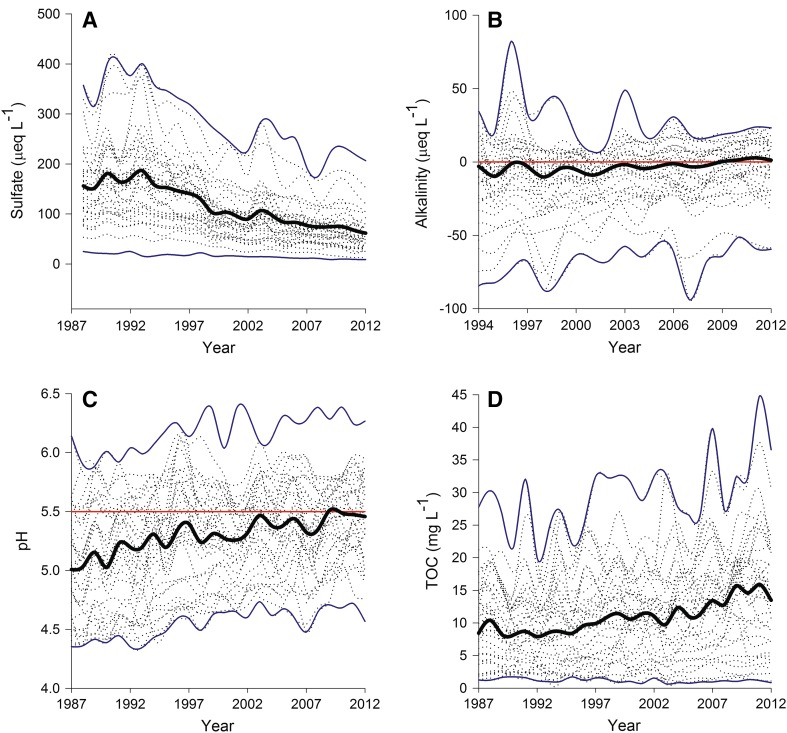
Fig. 2.
Spaghetti plots of annual sulfate concentration (a), alkalinity (b), pH (c) and total organic carbon (TOC; d) concentrations in acid-sensitive Swedish lakes. The thick black line shows the median value for observations made in a given year. Thin blue lines represent minimum and maximum values reported in a year. The thin grey lines represent individual lake time series. The red reference lines represent an alkalinity of 0 in b and a pH of 5.5 in c

