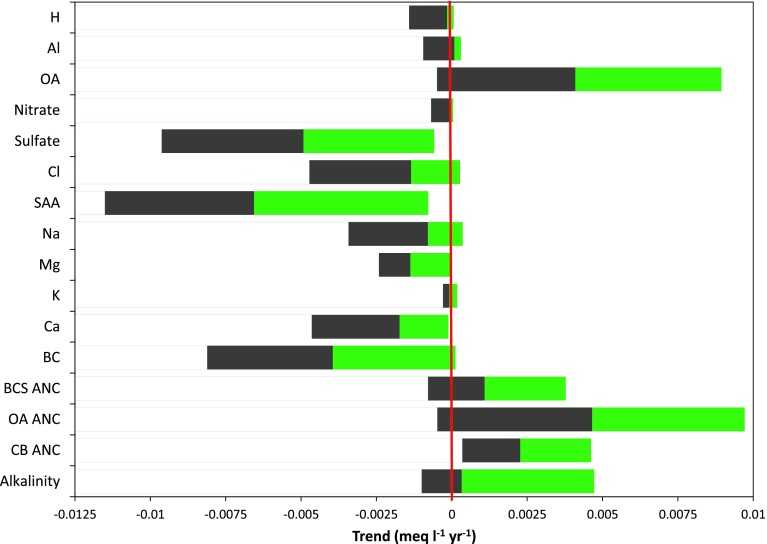
Fig. 5.
Trend summary for all analyzed parameters. Trends were estimated using the Sen slope. Trends are presented for all parameters from 1987 or 1988–2012, except for alkalinity where trends are reported for 1994–2012. Grey bars represent values below the median while green bars show values above the median. The break between grey and green represents the median trend for a determinand. The red line represents no change. All trends are expressed in µeq L−1 year−1

