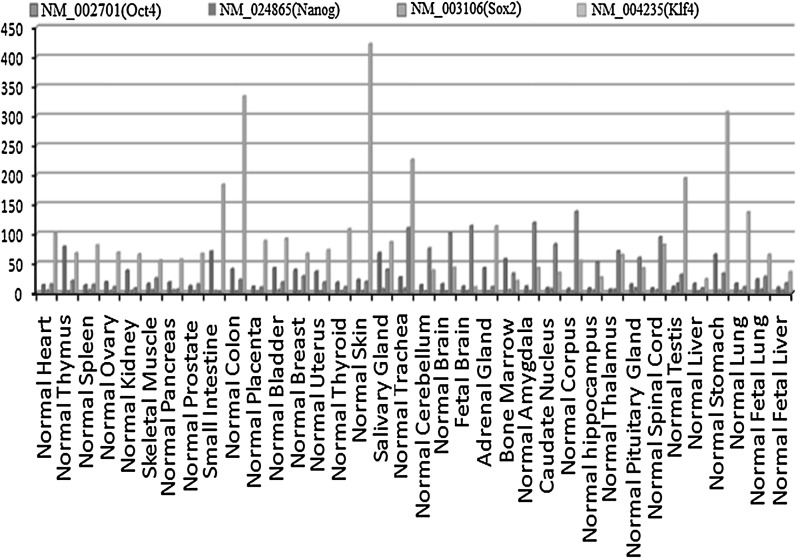
Fig. 10.
Expression levels of the transcription factors Oct4, Klf4, Sox2 and Nanog in 36 types of normal tissue. Each tissue RNA sample was pooled from several donors. Results identify tissue specific genes and provide baselines for interpreting gene expression in cancer. Expression data were treated with the RMA (Robust Multi-array Average) method. Each transcription factor was painted by a certain color in the Fig. The method used for the extraction of RNA have been presented in the materials and methods section

