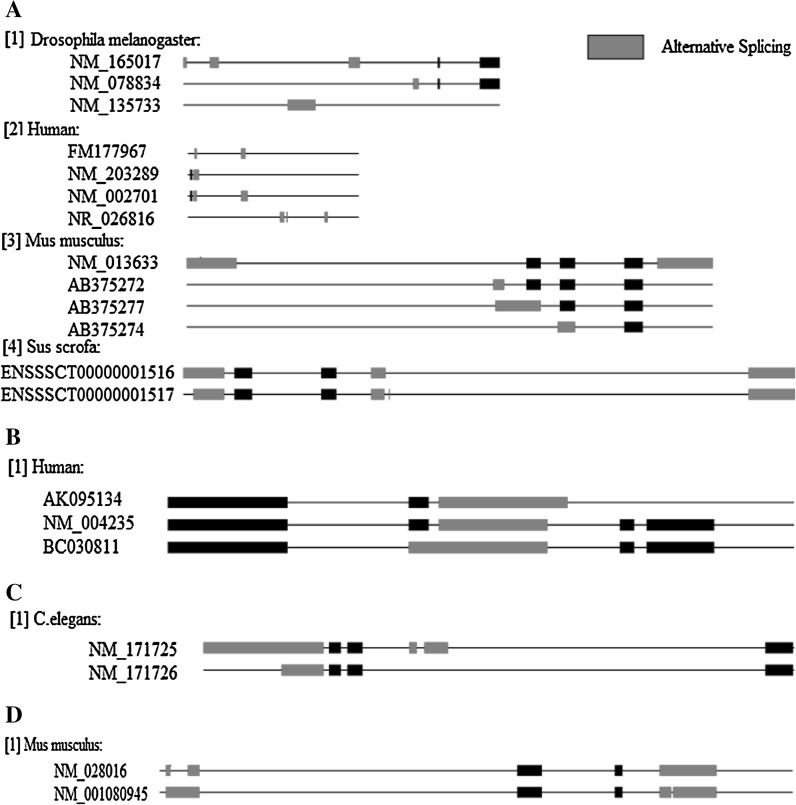
Fig. 6.
Alternative splicing of the transcription factors Oct4 (a), Klf4 (b), Sox2 (c) and Nanog (d) in ten species. Each line represents an individual transcript; exons are indicated by blocks, introns are represented by lines. Red exons have at least one different alternative splicing method. A black bold bar represent an exon that had no change in every different transcription

