Fig. 5.
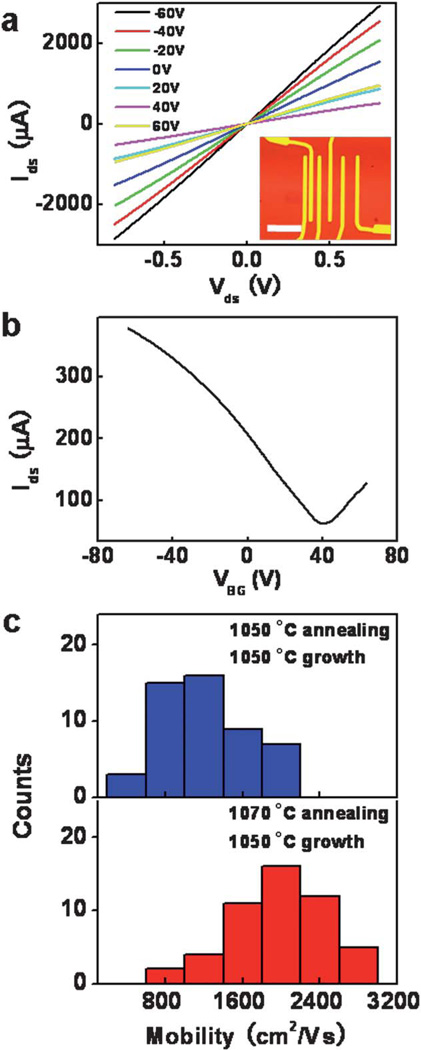
Representative room-temperature (a) Ids–Vds curves measured at various gate voltages (VBG = −60, −40, −20, 0, 20, 40, 60 V); (b) Ids–VBG curve measured at Vds = 0.1 V for the back-gated FET devices. Inset in (a) shows an optical image of the device; the scale bar is 20 µm. (c) A histogram of the carrier mobility distribution of the graphene prepared with the different synthetic processes.

