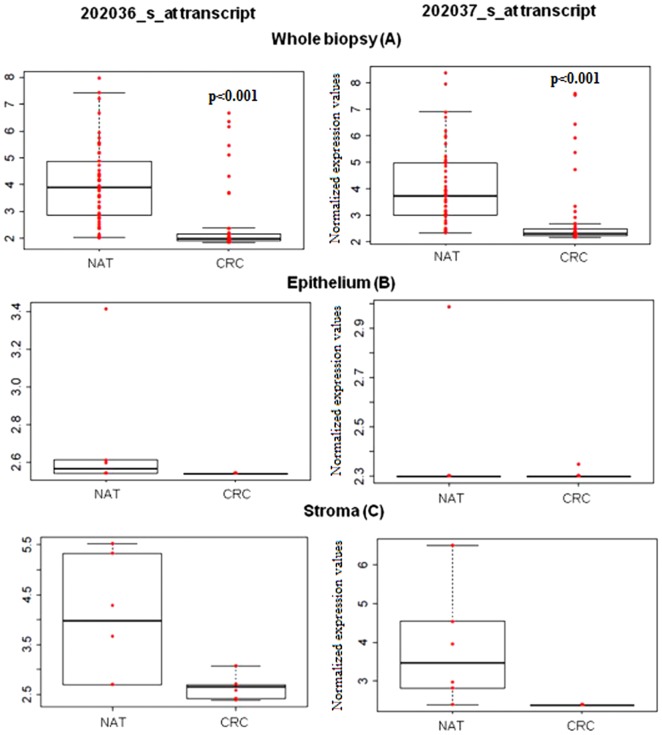
Figure 1. Gene expression of SFRP1 in epithelium and stroma of NAT and CRC samples (202036_s_at and 2020367_s_at transcripts).
According to normalized log2 fluorescence intensities, biopsy samples from NAT showed high SFRP1 expression, which was significantly (P<0.001) reduced in CRC samples (A). In epithelial cells only weak SFRP1 expression was detected both in NAT and CRC (B). In stroma SFRP1 expression was significantly increased (C). In this area a different scale was applied for data visualization.

