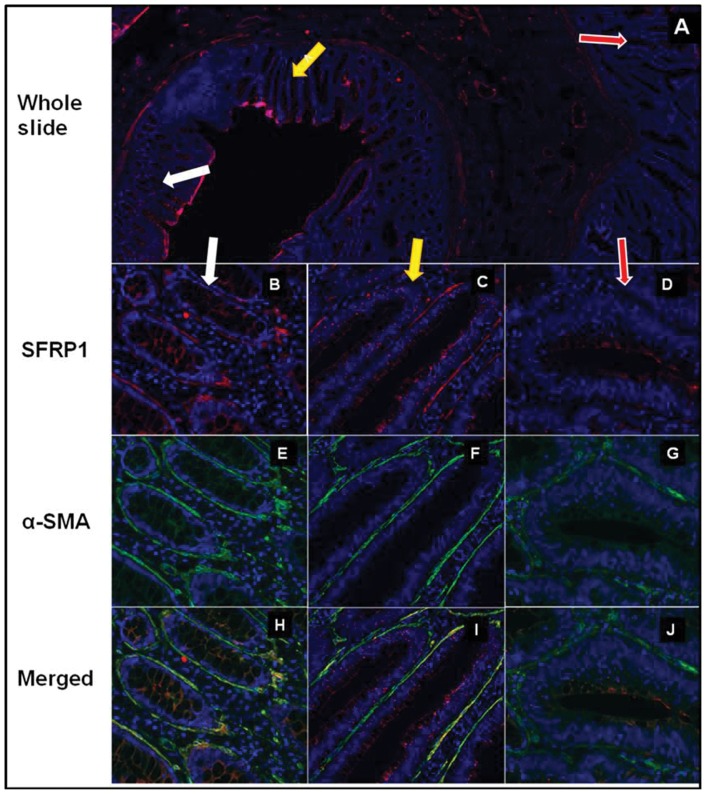
Figure 2. SFRP1 protein expression in α-SMA+ myofibroblasts in NAT, TA and CRC areas in representative photomicrographs.
SFRP1 protein expression (red immunofluorescent staining) in whole slide (A) which includes NAT (white arrow), TA (yellow arrow) and CRC (red arrow). Both in NAT region (in 9/9 cases; B) and TA (in 4/9 cases; C) α-SMA+ myofibroblasts (E, F) showed retained SFRP1 expression (85.73±12.61%) (B, C; merged pictures: H, I). Around most CRC glands α-SMA+ myofibroblasts (green immunofluorescent staining; G) showed reduced (P<0.001) SFRP1 expression (27.65%±18.27%; in 9/9 cases) (D; merged picture: J).

