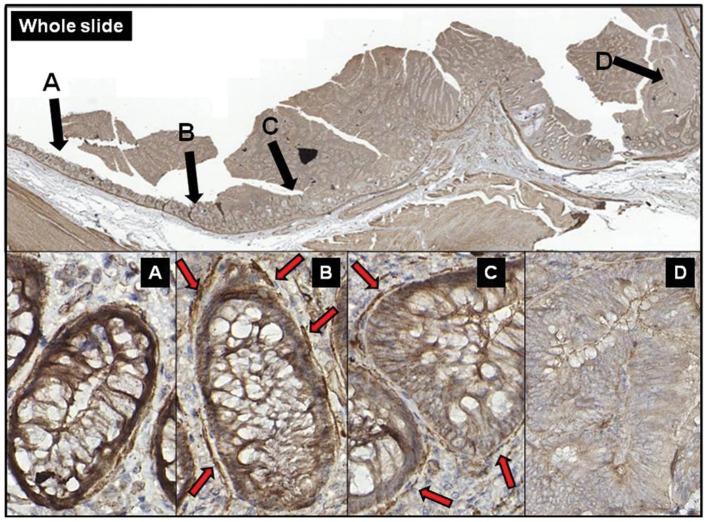
Figure 3. Change of epithelial SFRP1 protein expression with relative distance to the tumor in representative photomicrographs.
The expression of SFRP1 protein is almost equivalent in the epithelial layer and in the subepithelial myofibroblasts in normal areas (A). In NAT areas which were localized near the tumor (B) and TA (C) the epithelium showed decreased SFRP1 protein expression, while the subepithelial myofibroblasts retained their SFRP1 protein expression (red arrows). In high-grade dysplasia both the epithelial and the myofibroblast-derived SFRP1 protein expression significantly decreased (D).

